The ICT 2022 Model Explained
The ICT 2022 model is a specific intraday price-action setup taught by Michael J. Huddleston (the Inner Circle Trader) in his free 2022 YouTube mentorship: wait for a liquidity sweep, then a market structure shift with displacement, then enter on the fair value gap it leaves behind, inside the New York and London killzone hours. Often called the ICT 2022 mentorship model, it is one discretionary ICT model within the broader ICT/Smart Money Concepts framework, not an automated system or a guaranteed strategy.
What the ICT 2022 model actually is
The ICT 2022 mentorship model is a single, well-defined trade setup that Michael J. Huddleston taught during his free 2022 YouTube series. The name just refers to the year it was released; it does not mean a new version of the markets or a proprietary algorithm. It sits inside his wider body of work known as ICT or Smart Money Concepts (SMC), alongside other named setups like the Silver Bullet and the Unicorn model.
Two things anchor every decision in the model: time (which trading session you are in) and price (where liquidity and imbalances sit on the chart). The core idea is that price moves to take liquidity, the clusters of stop orders resting above old highs and below old lows, and to rebalance inefficient price moves. The trader tries to enter after a sweep of that liquidity and before price travels to the next obvious liquidity target.
The core sequence, step by step
Almost everything in the 2022 model reduces to one event chain: liquidity sweep, then displacement and a market structure shift, then a return to a fair value gap, then entry. Here is how it is commonly executed:
- Establish a directional bias (bullish or bearish) from higher timeframes such as the Daily, 4H or 1H. Without a bias, the rest of the setup loses its anchor.
- Mark a reference range and the obvious liquidity pools, for example the range from New York midnight (00:00 NY time) to the session open, plus prior-day and prior-session highs and lows.
- Wait for a killzone, then wait for a liquidity sweep. Price runs a prior high or low against your intended direction, taking out stops (for a long, it first sweeps a low, the classic "Judas swing").
- Look for displacement and a market structure shift (MSS) on a lower timeframe (5m, 3m or 1m): a strong, impulsive move that breaks the most recent short-term swing in your bias direction and leaves an imbalance behind.
- Identify the array left by that displacement leg, usually a fair value gap (FVG), but sometimes an order block, inverse FVG or breaker.
- Check premium and discount. For a long, the entry should sit in the discount (lower) half of the swept range; for a short, the premium (upper) half. The 50% mark is equilibrium.
- Wait for price to retrace back into the FVG. Do not chase the displacement candle itself.
- Enter at the array, place the stop beyond the swept extreme (the sweep wick), and target the opposite-side liquidity (the high or low that was the original draw on liquidity).
A typical timeframe split is higher timeframes for bias and liquidity mapping, then 5m down to 1m for the sweep, the shift and the entry. Educators often frame the target around 1:3 risk-to-reward or better, but treat any specific figure as an illustration, not an expected or guaranteed outcome.
The building blocks, defined
Liquidity and the liquidity sweep
Stop orders pool above old highs and below old lows. A sweep is price spiking through one of those levels to trigger the resting orders, then often reversing. In this model it is the precondition the trader waits for, not a signal to fade on its own.
Displacement
A strong, one-directional move, usually wide-range candles closing near their extreme, that signals intent and creates the fair value gap. In the 2022 model the structure shift is only treated as valid if it happens with displacement.
MSS versus BOS
This distinction trips up a lot of traders. A Break of Structure (BOS) is a continuation move, where price breaks a swing in the direction of the existing trend. A Market Structure Shift (MSS) is a potential reversal, where price breaks a swing against the prior short-term trend, for example breaking the most recent lower high to the upside inside a short-term downtrend. The 2022 model uses an MSS as its trigger after the sweep. Note that ICT terminology is not perfectly standardised; some traders call the same idea a CHoCH (change of character).
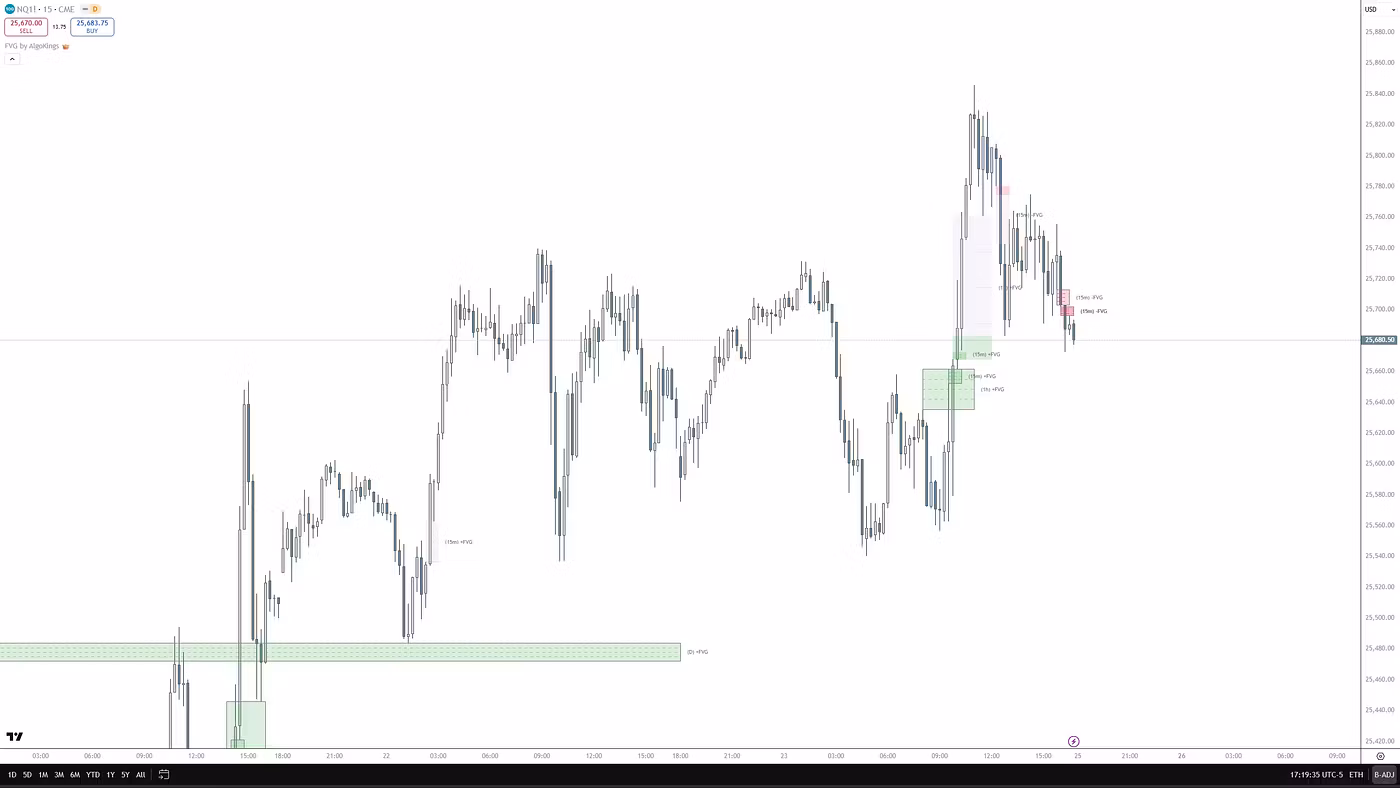
Fair value gap (FVG)
A three-candle pattern where the high of the first candle and the low of the third candle (for a bullish FVG) do not overlap, leaving a gap that the middle candle ran through. It marks a zone of inefficient delivery that price often returns to rebalance. In this model the FVG is the primary entry zone, and it is the last step, not the trigger.
Premium, discount and the PD array
PD array is ICT's umbrella term for premium/discount reference levels such as FVGs, order blocks and breakers. Premium is the upper half of a range (favours selling), discount is the lower half (favours buying), and equilibrium is the 50% midpoint.
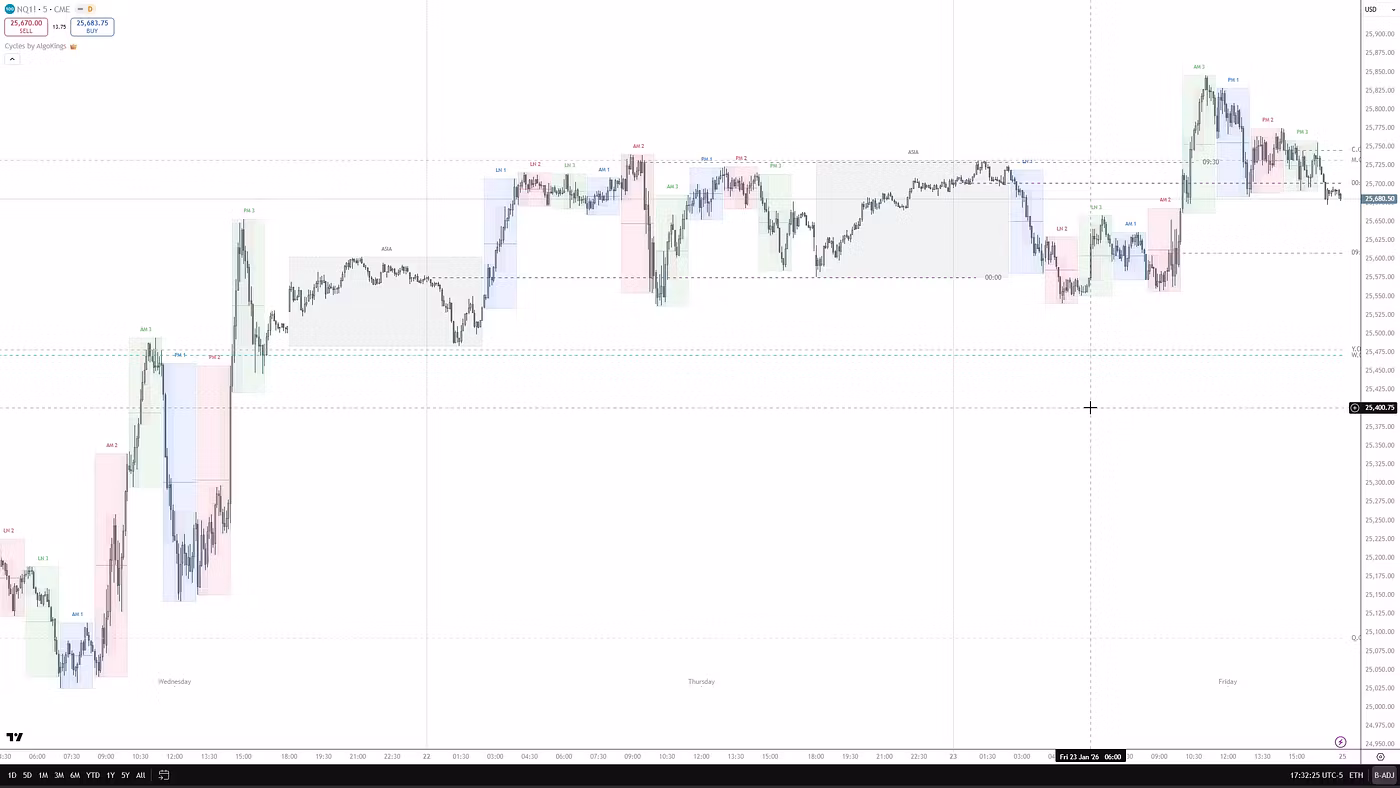
Timing: the killzones
Time is half the model, and ICT timing is quoted in New York local time. The setup is meant to be hunted inside specific windows, not all day:
- London Open killzone, roughly 02:00 to 05:00 NY time (some teach starting around 03:00).
- New York AM killzone, roughly 07:00 to 10:00 NY time, spanning the 08:30 news window and the 09:30 stock open. This is the most-cited window for the 2022 model.
- New York midnight (00:00) as the daily open reference, plus the London Close killzone (around 10:00 to 12:00) and the Asian range as context.
A related framing is the Power of Three: accumulation, then manipulation (the sweep, or Judas swing), then distribution (the expansion). Using local or broker time instead of New York time is a common and avoidable way to break the whole killzone logic.
Common mistakes and misconceptions
- Trading a fair value gap in isolation, with no prior sweep and no shift. The FVG is the final confirmation, not the signal.
- Skipping higher-timeframe bias and taking sweeps in both directions, which turns the model into overtrading.
- Confusing MSS with BOS, so entering on trend continuation instead of the counter-trend shift, or calling any small wick a sweep.
- Entering in premium for a long or in discount for a short, ignoring where price sits in the range.
- Hindsight labelling: it is easy to point at a past chart and see sweep into shift into gap. Doing it live, left to right, is far harder, so be sceptical of screenshots that only show winners.
- Treating "the algorithm" as a literal, knowable machine. It is a conceptual model of order flow, not a disclosure of how any exchange or bank routes orders.
Does it actually work? An honest look
Be clear-eyed here. ICT's methods are widely discussed, but they are not validated by independent, peer-reviewed research, and Huddleston has not published audited trading returns. Critics argue the concepts are flexible enough to fit almost any chart in hindsight, which makes them hard to falsify. One frequently cited item is an OSF preprint by Rounak Agarwal that backtests the Power of 3 idea across a basket of FX pairs over roughly two decades. Its limits matter: it is a preprint, not peer-reviewed or journal-published; it tests the Power of 3 daily-range concept, not the full 2022 entry model; and it is a single author's work. At most it is weak, supportive evidence for one related idea, not proof that the 2022 model is profitable.
Treat the 2022 model as a framework many retail traders use to organise their analysis, not as a proven edge. Most retail traders lose money, past patterns do not guarantee future results, and this article is educational content, not financial advice.
Where indicators fit (and where they do not)
The 2022 model is discretionary: "liquidity," "displacement" and a "valid MSS" all require judgment, and two traders can mark the same chart differently. Indicators that auto-detect FVGs, sweeps, market-structure shifts and killzones can speed up that marking and reduce the chance you miss a level, but they do not replace understanding the sequence, and they can be wrong or lagging. AlgoKings tools such as the FVG indicator and the broader SMC package are built to highlight these components on your chart; think of them as assistance for your own discretionary process, not a system that tells you when to buy or sell. The mentorship itself was released free on YouTube, so the primary material is ICT's own channel; be wary of third parties reselling it.
Frequently asked questions
What is the ICT 2022 model in simple terms?
It is a setup where you wait for price to sweep a prior high or low (taking stops), then show a market structure shift with strong displacement in your bias direction, then retrace into the fair value gap left behind, which is where you enter. It is traded inside London and New York killzone hours, with the stop beyond the swept extreme and the target at opposite-side liquidity.
What is the difference between the ICT 2022 model and the Silver Bullet or other ICT models?
They are different specific setups within the same ICT / Smart Money Concepts framework. The 2022 model is the sweep into shift into fair-value-gap sequence described here. The Silver Bullet, Unicorn and others use different triggers, time windows or pattern combinations. They share concepts like liquidity, FVGs and killzones but are not the same playbook.
What timeframes should I use for the 2022 model?
Higher timeframes (Daily, 4H, 1H, sometimes 15m) are commonly used to set the directional bias and map the liquidity pools. Lower timeframes (5m, 3m, 1m) are then used to spot the liquidity sweep, the market structure shift and the fair value gap entry. The higher timeframe indicates which direction to hunt; the lower timeframe gives the precise entry.
What is the difference between MSS and BOS?
A Market Structure Shift (MSS) breaks a swing against the prior short-term trend and signals a potential reversal; this is what the 2022 model uses as its trigger after a sweep. A Break of Structure (BOS) breaks a swing in the direction of the existing trend and signals continuation. Entering on a BOS when the model calls for an MSS is a common mistake.
What time is the ICT 2022 model usually traded?
Inside the killzones, quoted in New York time: the London Open window (roughly 02:00 to 05:00 NY) and the New York AM window (roughly 07:00 to 10:00 NY), with New York midnight as a daily reference. It is not meant to be traded all day. Using broker or local time instead of New York time is a frequent error that breaks the timing logic.
Does the ICT 2022 model actually work, and do I need to pay for it?
There is no independent, peer-reviewed proof that it is profitable, and no audited track record; results are mostly anecdotal, and critics note the concepts can fit charts in hindsight. The one commonly cited study is a non-peer-reviewed preprint on the related Power of 3 idea, not the full model. As for cost, the 2022 mentorship was released free on ICT's own YouTube channel, so be cautious about third parties reselling it.
Risk disclosure
AlgoKings provides technical analysis indicators and educational material for informational purposes only. Nothing on this website is financial, investment or trading advice. Trading financial instruments carries a high level of risk and may not be suitable for every investor; you can lose some or all of your capital. Indicators do not predict future price movements and do not guarantee any outcome. You are solely responsible for your own trading decisions and risk management. Past performance is not indicative of future results.