How to Trade Liquidity in Smart Money Concepts: A Practical Guide
In Smart Money Concepts (SMC), liquidity means clusters of resting orders — mostly stop-losses and breakout orders — sitting at obvious price levels like equal highs and lows. Trading liquidity comes down to a simple loop: identify where those orders pool, wait for price to sweep through them, then enter on the confirmed reversal toward the next pool. This guide explains how to trade liquidity honestly — it is a discretionary way to read price, not a guaranteed system, and trading carries a substantial risk of loss.
What liquidity actually means in SMC
Traders tend to behave predictably. Many buy at support, sell at resistance, and tuck their stop-losses just beyond recent highs and lows. Because so many people act the same way in the same places, orders pile up at those levels. SMC calls these piles liquidity pools — the 'fuel' that lets large participants fill sizeable positions, since a big order needs a pool of opposing orders to execute against.
The single most-confused point is direction, so anchor it now: buy-side liquidity sits ABOVE price, sell-side sits BELOW. The reason comes down to whose stops live there.
- Buy-side liquidity (BSL): resting buy orders above swing highs, equal highs, and obvious resistance. These are mostly short-sellers' stop-losses (a stop on a short is a buy order) plus breakout buy-stops.
- Sell-side liquidity (SSL): resting sell orders below swing lows, equal lows, and obvious support. These are mostly longs' stop-losses (a stop on a long is a sell order) plus breakout sell-stops.
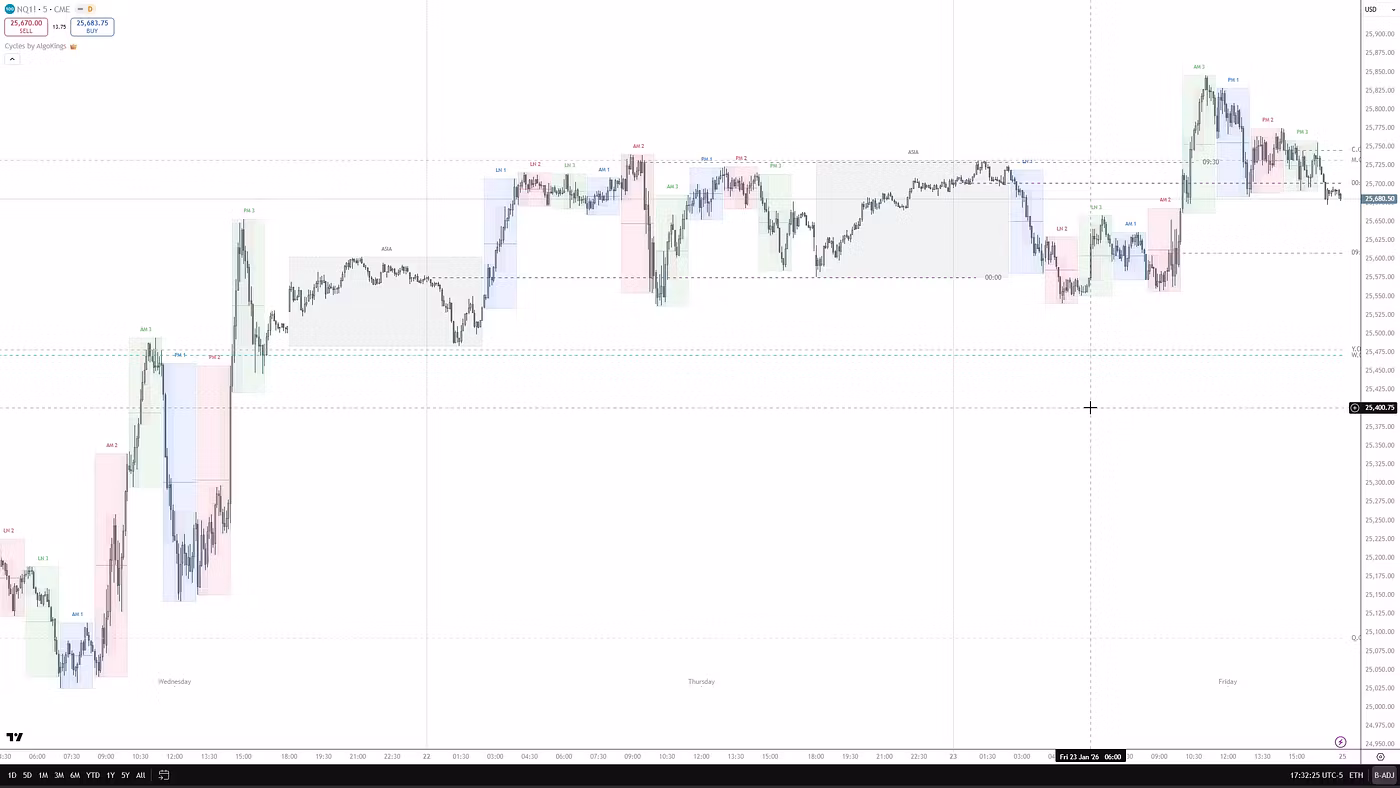
Equal highs and equal lows — two or more swings stopping at almost the same price (a double top or double bottom) — are the textbook target, because they stack orders into an especially obvious pool.
Sweeps, grabs, and inducement
A liquidity sweep is when price spikes through a level, triggers the resting stops, then reverses — often confirmed over a few candles. A liquidity grab usually refers to the same idea on a shorter scale: price only wicks beyond the level and closes back inside, sometimes within a single candle. 'Stop hunt' or 'stop run' are colloquial names for the same event seen from the trapped trader's side. In practice the terms overlap heavily and many traders use them interchangeably, so treat the labels loosely rather than as a strict taxonomy.
Inducement: the bait before the target
Inducement is a nearer, more obvious level that tends to lure traders into early entries — and collect their stops — before price moves to the real objective. Example: in an uptrend, an obvious minor low sits just below price. Some traders short the 'breakdown' and longs place stops under it. Price dips, takes that induced liquidity, then resumes upward toward the actual draw. The first pool acted as bait for the second.
Internal vs external liquidity and the draw
It helps to split liquidity into two layers and watch how price rotates between them:
- External range liquidity (ERL): the swing highs and lows that bound a range — the obvious targets sitting at the edges.
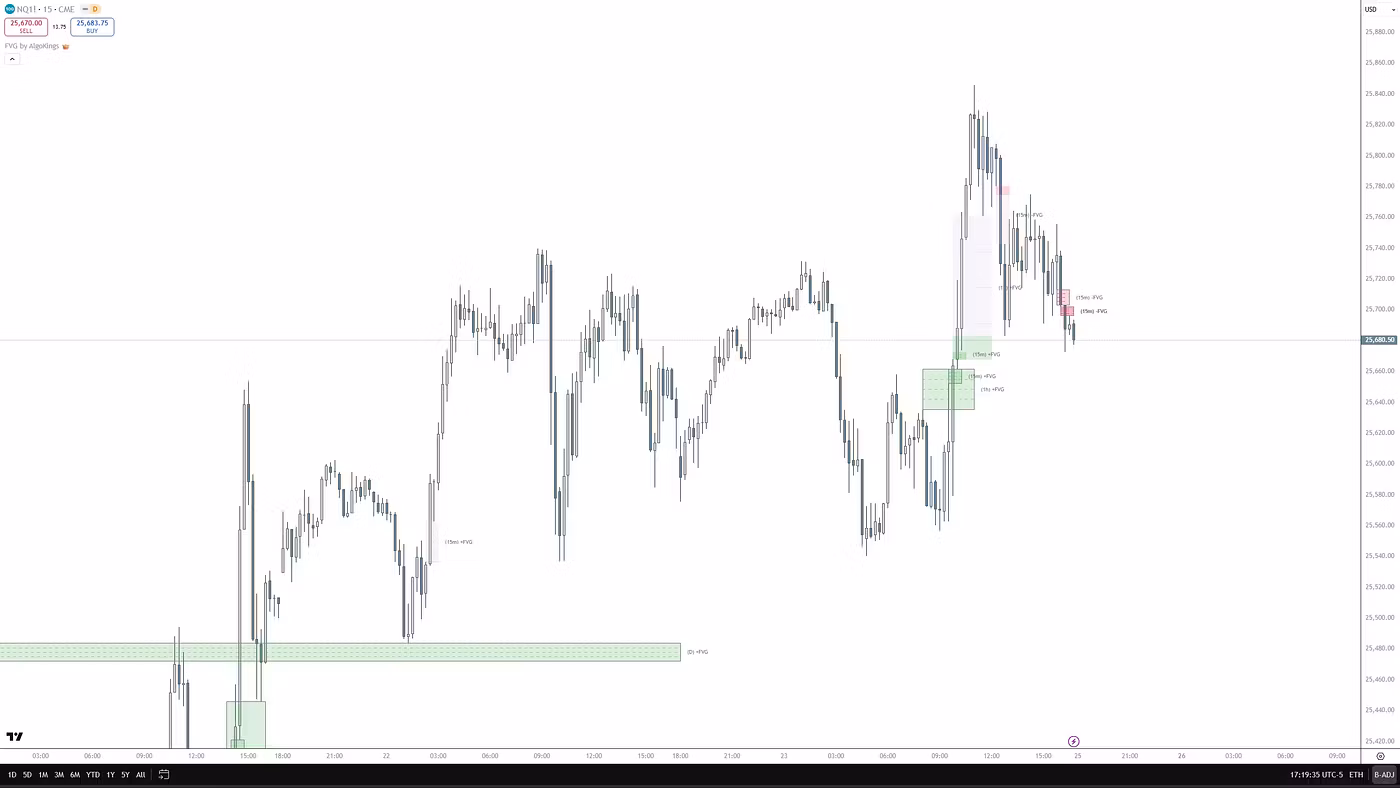
- Internal range liquidity (IRL): inefficiencies inside the range, chiefly Fair Value Gaps (FVGs) or imbalances.
- The oscillation idea: price often reaches ERL, gets drawn back to fill IRL, then gets drawn back out to ERL again.
The draw on liquidity (DOL) is simply the level price seems most likely to head toward next — your working target. It might be equal highs/lows, an old swing point, an unfilled FVG, or a 'smooth' low-resistance area with little prior trading.
A step-by-step liquidity trading strategy
The most widely taught sequence is Sweep, then Market Structure Shift, then entry at an order block or FVG. Each step exists to add confirmation, because the reversal is never guaranteed.
- 1. Mark the liquidity. Identify BSL and SSL ahead of time — equal highs/lows, prior session highs/lows, clean swing points. Note your higher-timeframe bias first; a setup against that bias is a lower-probability, counter-trend trade.
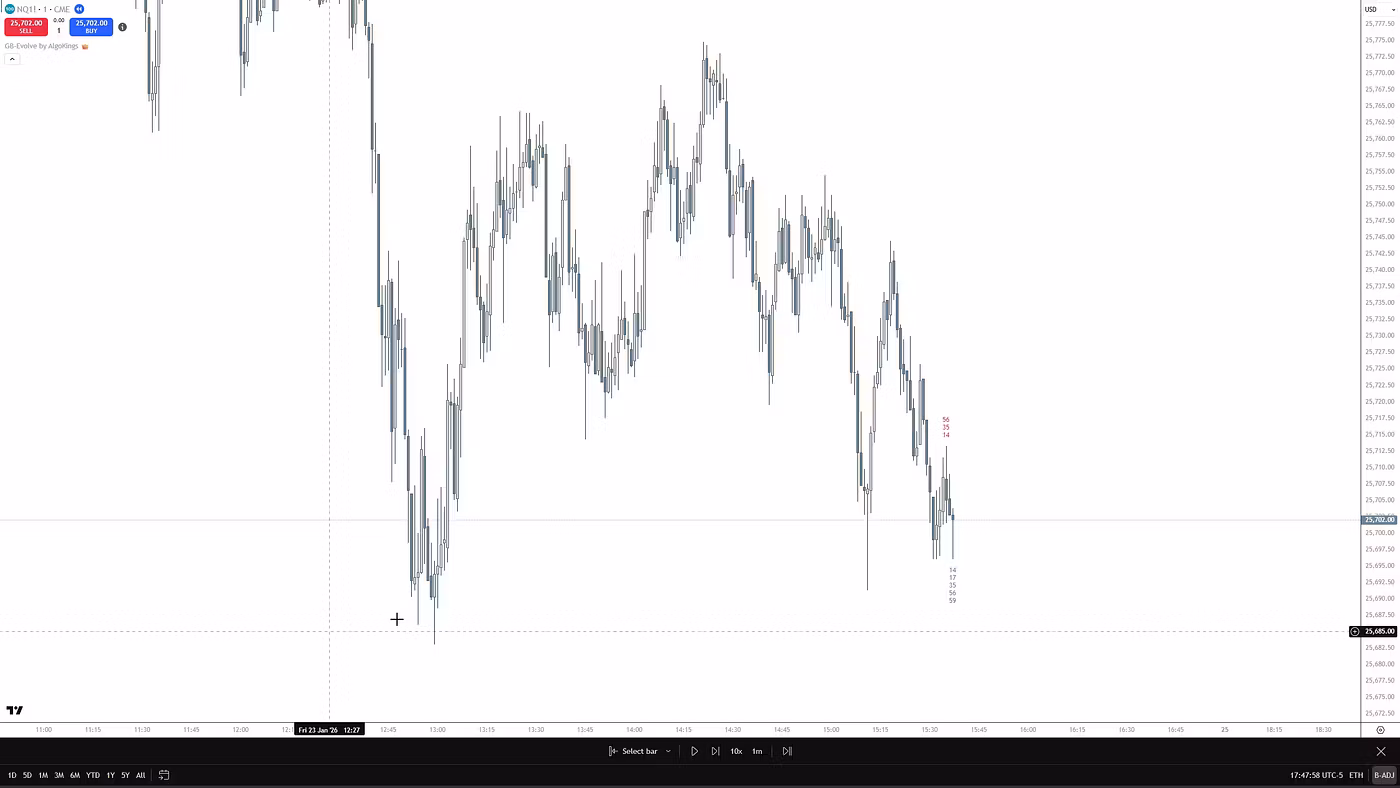
- 2. Wait for the sweep. Let price take out the level and trigger the stops. Avoid entering on the wick or front-running the move — this is the discipline rule beginners most often break.
- 3. Wait for confirmation (MSS/BOS). Look for a clean break of short-term structure in the opposite direction — a Market Structure Shift or Break of Structure. A close back inside the level or a fresh FVG forming in the reversal direction are common confirming signs.
- 4. Enter on the retracement. Some traders enter as price pulls back into the order block (OB) or FVG left by the impulsive reversal move, sometimes combined with a Fibonacci OTE zone.
- 5. Place the stop beyond the sweep extreme. Above the sweep high for a short, below the sweep low for a long — past the wick, so a quick re-test does not knock you out of an otherwise valid idea.
- 6. Target opposing liquidity. Aim at the next pool: the opposing swing high/low, equal highs/lows, or opposing order block. A roughly 1:2 risk-reward is a common convention, not a promised outcome.
A frequently cited confluence is three things lining up at once: an order block plus a Fair Value Gap plus a liquidity sweep. If you want tooling for this read, AlgoKings' SMC Package and the standalone FVG indicator mark structure and imbalances on the chart so you spend less time drawing by hand — they are analytical aids, not trade signals, and they do not tell you when to buy or sell.
Common mistakes to avoid
- Entering on the wick. Front-running the sweep instead of waiting for the MSS is the number-one beginner error.
- Inverting the sides. Putting buy-side below price or sell-side above. Repeat the anchor: buy-side above, sell-side below.
- Treating every 'BOS' and every order block as equal. Misreading a normal internal pullback as a structure break, or assuming all order blocks carry the same weight.
- Ignoring the higher timeframe. Letting lower-timeframe noise override the dominant bias.
- Tool overload. Stacking so many confluences that signals conflict and you never act with conviction.
- Curve-fitting in hindsight. SMC labels fit any past chart cleanly; real-time is far messier than the replay.
An honest look at whether this works
Be clear-eyed about two things. First, the literal story that institutions hunt your individual stops is not established fact — market makers do not know where your specific stop sits. The more defensible version is behavioral: orders cluster at obvious levels, and price often gravitates toward those clusters. You are collateral in a move toward a pool, not a personally targeted victim. Treat the liquidity-pool pattern as an observable tendency, not proof of deliberate manipulation.
Second, much of SMC is rebranded price action and supply-demand analysis. An 'order block' is close to a supply/demand zone; new jargon is not automatically a new edge. There is no robust public, peer-reviewed, large-sample evidence that SMC produces an edge by itself, and the narrative is flexible enough to explain almost any chart after the fact. Whatever edge exists tends to come from execution — selectivity, risk management, and discipline — not from the labels. Use liquidity as a lens for reading price and structure, size positions so any single loss is survivable, and remember this is education, not financial advice.
Frequently asked questions
What is liquidity in Smart Money Concepts?
Liquidity is a cluster of resting orders — mostly stop-losses and pending breakout orders — concentrated at obvious price levels such as swing highs, swing lows, and equal highs/lows. These pools form because traders place orders predictably, and SMC treats them as the fuel large participants need to fill sizeable positions.
What is the difference between buy-side and sell-side liquidity?
Buy-side liquidity is resting buy orders ABOVE price (largely short-sellers' stops plus breakout buy-stops), and sell-side liquidity is resting sell orders BELOW price (largely longs' stops plus breakout sell-stops). The memory aid: buy-side above, sell-side below. A run up into buy-side often precedes a drop, and a run down into sell-side often precedes a bounce.
Is a liquidity grab the same as a liquidity sweep?
They describe nearly the same idea: price pushes through a level, triggers the resting stops, then reverses. The usual nuance is that a 'grab' only wicks past the level and closes back inside, sometimes within a single candle, while a 'sweep' is often confirmed over a few candles. In practice the terms overlap and are frequently used interchangeably, and 'stop hunt' is just a colloquial name for the same event.
How do you actually trade a liquidity sweep?
The common model is: mark the liquidity, wait for price to sweep it, then wait for a Market Structure Shift or Break of Structure to confirm the reversal — rather than entering on the wick. Many traders then enter on the pullback into the order block or FVG left by the reversal, place the stop beyond the sweep extreme, and target the opposing liquidity pool.
Where do I place my stop loss and target?
A common approach is to place the stop beyond the sweep's extreme — above the sweep high for a short, below the sweep low for a long — so a re-test of the wick does not knock you out, and to target opposing liquidity such as the next swing high/low, equal highs/lows, or opposing order block. Many traders frame this around a minimum 1:2 risk-reward, but that ratio is a convention, not a guaranteed outcome.
Does trading liquidity actually work, and do institutions really hunt my stops?
Evidence is mixed and largely anecdotal — there is no robust public proof that SMC produces an edge on its own. Orders genuinely do cluster at obvious levels and price tends to gravitate toward them, but the literal claim that institutions hunt your personal stops is unproven; you are collateral in a move toward a pool, not an individual target. Any real edge tends to come from disciplined execution and risk management, not the terminology.
Risk disclosure
AlgoKings provides technical analysis indicators and educational material for informational purposes only. Nothing on this website is financial, investment or trading advice. Trading financial instruments carries a high level of risk and may not be suitable for every investor; you can lose some or all of your capital. Indicators do not predict future price movements and do not guarantee any outcome. You are solely responsible for your own trading decisions and risk management. Past performance is not indicative of future results.