How to Read Market Structure: A Practical Guide to BOS, CHoCH & Swings
Reading market structure means mapping a chart's sequence of swing highs and swing lows to answer one question: is price trending up, trending down, or ranging? It is a descriptive lens read straight from price action — not a predictive system — and it is the foundation most SMC and ICT concepts (liquidity, order blocks, FVGs) are built on. Learning how to read market structure is usually the first step in any market structure trading approach, so this guide keeps it concrete and honest.
The three states of market structure
Before any of the jargon, market structure boils down to three conditions. Learning to classify which one you're looking at is most of the skill — the labels (BOS, CHoCH) just describe transitions between them.
- Uptrend (bullish): a series of Higher Highs (HH) and Higher Lows (HL) — upward stair-steps where buyers keep pushing price to new peaks and defending higher troughs.
- Downtrend (bearish): a series of Lower Highs (LH) and Lower Lows (LL) — downward stair-steps where sellers keep forcing new lows.
- Range / consolidation: roughly equal highs and equal lows with no clear progression. By many estimates the market spends the majority of its time here (a figure around 70% is often cited, though it varies by instrument and timeframe).
The building blocks: swing highs and swing lows
Everything starts with swing points. A swing high is a candle whose high sits above the candles on both sides — price peaked locally, then turned down. A swing low is the mirror image: a candle whose low sits below its neighbors, marking a local bottom before price turned up.
To filter out noise, many traders require a set number of candles on each side (a value around 3 is common) that are lower for a high, or higher for a low. There is nothing magic about that number — it is a discretionary setting you choose, not a market law. A larger value gives you fewer, more significant swings; a smaller value picks up more minor ones.
BOS vs CHoCH: continuation vs potential reversal
These two terms describe what happens when price breaks a swing point. They are the most-searched distinction in market structure trading, and confusing them is one of the most common errors.
Break of Structure (BOS) — continuation
A BOS occurs when price breaks a swing point in the direction of the existing trend, confirming the trend is intact. In an uptrend, price breaking above the most recent swing high prints a new HH — a bullish BOS. In a downtrend, breaking below the most recent swing low prints a new LL — a bearish BOS. Some traders also call a break of structure an MSB (market structure break).
Change of Character (CHoCH) — potential reversal
A CHoCH is the first structural break against the prevailing trend — the earliest objective hint that a trend may be turning. In an uptrend, it's when price breaks below the most recent Higher Low. In a downtrend, it's when price breaks above the most recent Lower High.
A CHoCH is a warning, not a confirmed reversal. The stronger pattern taught is a CHoCH followed by a BOS in the new direction — meaning structure has actually started printing the opposite sequence (for example, the first Lower High and Lower Low after an uptrend). A note on terms: MSS (Market Structure Shift) is often used as a near-synonym for CHoCH, with some teachers treating MSS as a more aggressive, displacement-driven version. Usage genuinely varies between ICT and broader SMC communities, so focus on the mechanic — continuation versus potential reversal — rather than policing the label.
Internal vs swing structure (why you get false signals)
This is the section that resolves most 'why does my structure keep lying to me' frustration. Swing (external) structure is made of the major highs and lows on your chosen timeframe — it defines the trend you're trading. Internal structure is the smaller swings inside each leg: lower-timeframe wiggles that are useful for refining entries but are a major source of false signals.
A widely taught filter: a valid CHoCH breaks the swing that produced the previous BOS, while internal highs and lows 'don't count' for the major read. Treating an internal pullback as a genuine trend change is frequently cited as the single biggest mistake in reading structure.
The most important rule: candle close, not wick
A break is best confirmed by a candle body closing beyond the level — not by a wick poking through it. A wick that pierces a swing and snaps back is better read as a liquidity sweep (a stop hunt) than a structural break. Price routinely spikes just past an obvious swing to trigger resting stop orders before reversing, which is exactly why close-confirmation exists.
Two practical caveats. First, 'close' is always relative to the timeframe you're analyzing — on a 1H chart you wait for the 1H close. Second, body-close confirmation is a sensible and popular convention, not a universal law; some traders define breaks differently. What matters most is consistency: pick one definition and apply it on every chart, every time. Switching methods chart-to-chart tends to produce contradictory signals.
Reading across timeframes (top-down)
No single timeframe should be read in isolation. The higher timeframe generally carries more weight, so a typical workflow runs top-down: the higher timeframe (weekly/daily) sets directional bias, a mid timeframe shows swing structure, and a lower timeframe (4H/1H/15m) refines entry timing. A 15-minute bullish signal that contradicts a clearly bearish daily chart is lower-probability — confluence across timeframes is generally worth more than any isolated break.
What structure can and can't tell you
- Structure is descriptive, not predictive. It organizes what price has already done; BOS and CHoCH are probabilistic hints, not guarantees of what comes next.
- Marking swings is partly subjective. Two skilled traders can label the same choppy chart slightly differently — if the swings are genuinely ambiguous, that ambiguity is itself a sign you may be in a range.
- Liquidity sweeps and stop hunts are normal, not anomalies — expect price to overshoot obvious levels at times.
- SMC and Goldbach framing like 'smart money,' 'inducement,' and 'liquidity engineering' is an interpretive overlay. The observable object is the price structure itself; narratives about exactly what institutions are doing are interpretation, not measured fact.
- Structure tends to read more cleanly on liquid, smoothly-moving instruments (major forex, futures, large-cap stocks, crypto majors). Overnight equity gaps and illiquid assets can jump levels and distort the read.
Where indicators fit in
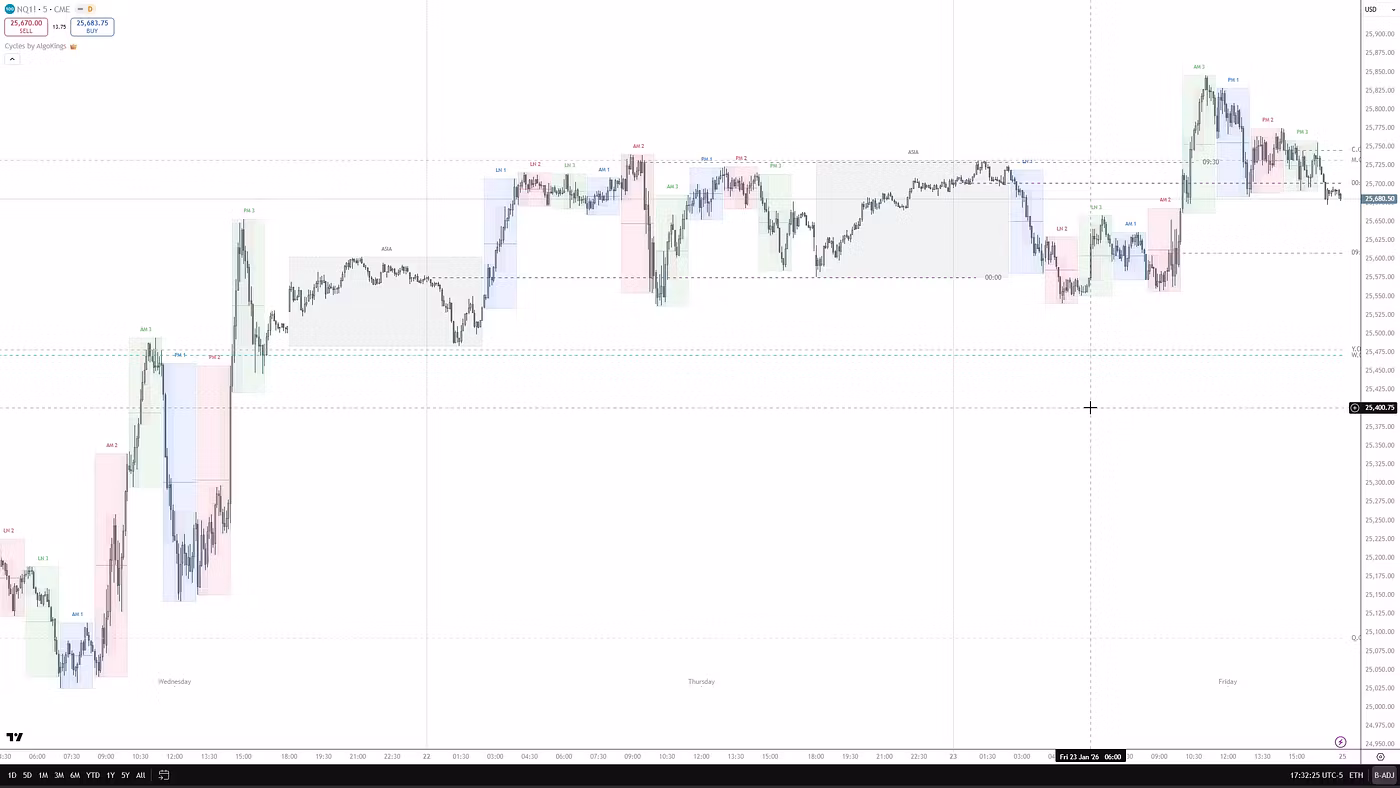
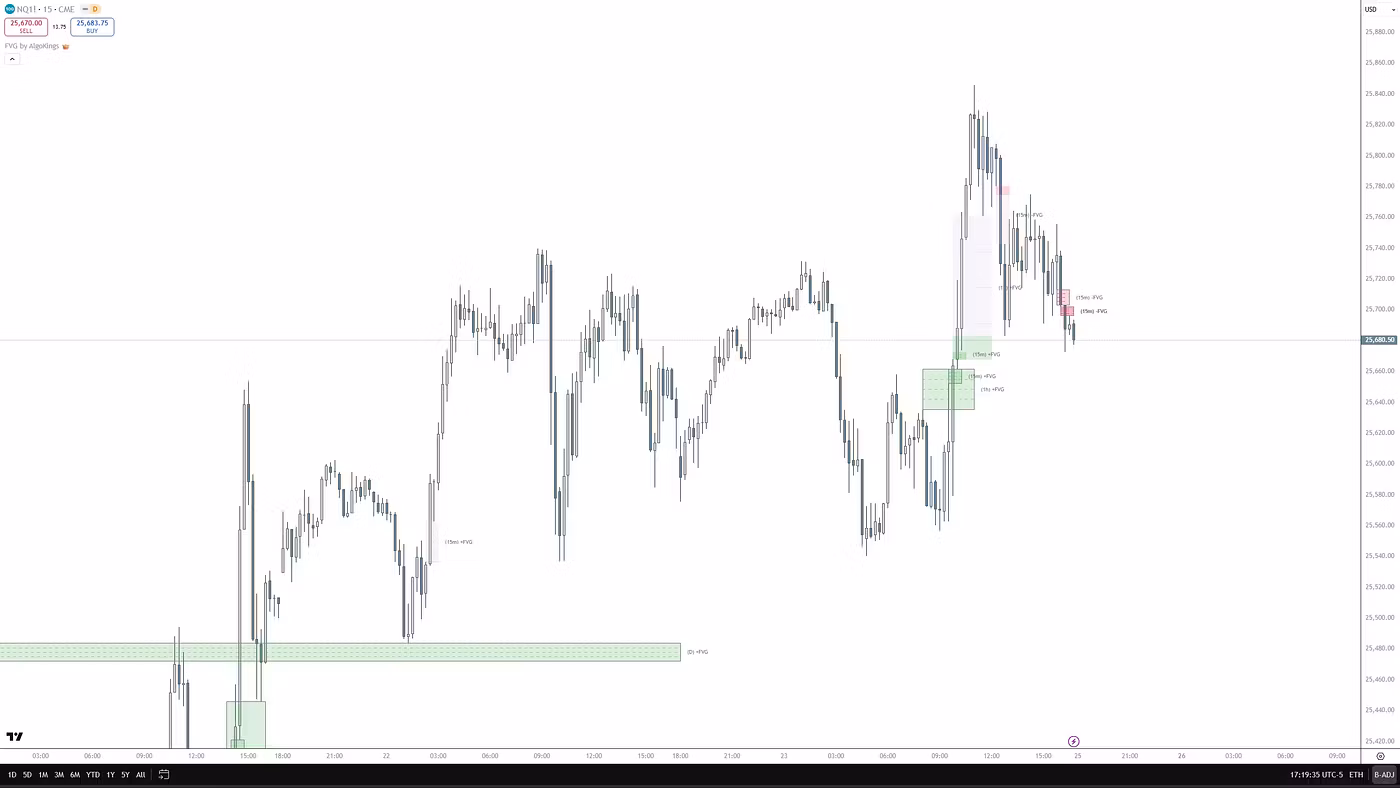
Once you can mark swings, BOS, and CHoCH by hand, automated labeling tools can speed up the chart work — but they don't change the fundamentals above. The AlgoKings SMC package and Goldbach (GB) tools are built to auto-detect swing points and tag BOS/CHoCH on the chart, which removes some of the manual work and enforces a consistent definition across instruments. Treat them as an aid to reading structure — a visualization and labeling layer — not as a signal-to-profit machine. The discretionary judgment (which timeframe, whether you're trending or ranging, whether a break is a real close or a sweep) still belongs to you.
This article is educational and is not financial advice. Nothing here promises profitability; no single signal should drive a trade in isolation, and false breaks, ranges, and sweeps are a normal part of every market.
Frequently asked questions
What's the difference between BOS and CHoCH?
A Break of Structure (BOS) is a break in the direction of the existing trend — it signals continuation (a new Higher High in an uptrend, or a new Lower Low in a downtrend). A Change of Character (CHoCH) is the first break against the trend — it's the earliest hint of a potential reversal, such as price breaking below the most recent Higher Low in an uptrend. In short: BOS = continuation; CHoCH = potential reversal. A CHoCH is a warning, not a confirmed turn, and is considered stronger when followed by a BOS in the new direction.
Does a wick count as a break of structure, or do I wait for the candle to close?
The widely taught convention is to wait for a candle body to close beyond the level. A wick that pokes through and snaps back is usually treated as a liquidity sweep (stop hunt) rather than a real structural break — price often overshoots obvious swings to grab stops before reversing. 'Close' means the close of the timeframe you're trading (a 1H chart uses the 1H close). This isn't a universal law, but it's a sensible filter; the key is to apply one definition consistently.
What's the difference between internal and swing (external) structure?
Swing or external structure is built from the major highs and lows on your chosen timeframe and defines the trend you're trading. Internal structure is the smaller swings inside each leg — lower-timeframe noise. Internal moves are useful for fine-tuning entries but are a major source of false signals. A common rule: a valid CHoCH breaks the swing that created the previous BOS, while internal highs and lows don't count toward the major structural read. Mistaking internal noise for a real trend change is one of the most common errors in reading structure.
Which timeframe should I read market structure on?
There's no single 'correct' timeframe — what matters is alignment across several. A top-down approach is standard: use a higher timeframe (weekly/daily) to set directional bias, a mid timeframe for swing structure, and a lower timeframe (4H/1H/15m) for entry timing. The higher timeframe generally dominates, so a lower-timeframe signal that contradicts your higher-timeframe bias is lower-probability. Confluence across timeframes is usually worth more than any isolated break.
How do I tell a real reversal from a liquidity sweep or stop hunt?
The clearest filter is the candle close. A liquidity sweep typically spikes a wick just beyond an obvious swing and then reverses, leaving no body close past the level — it's grabbing stops, not changing structure. A more credible reversal shows a body close beyond the level, and ideally follows through: a CHoCH against the old trend followed by a BOS in the new direction. Sweeps are completely normal and expected, which is exactly why close-confirmation and waiting for follow-through matter.
How do I read market structure in a ranging market?
Carefully — this is where structure signals are least reliable. In a range you'll see roughly equal highs and equal lows with no clear progression, and break signals tend to flip back and forth, producing whipsaw. If your swing points are ambiguous or structure keeps reversing on you, that's often a sign you're ranging rather than trending. Many traders either stand aside in clear ranges or wait for a decisive, well-confirmed break out of the range before trusting structure again. Markets tend to range a large share of the time, so this isn't an edge case — it's a default condition to plan for.
Risk disclosure
AlgoKings provides technical analysis indicators and educational material for informational purposes only. Nothing on this website is financial, investment or trading advice. Trading financial instruments carries a high level of risk and may not be suitable for every investor; you can lose some or all of your capital. Indicators do not predict future price movements and do not guarantee any outcome. You are solely responsible for your own trading decisions and risk management. Past performance is not indicative of future results.