Stop Hunts Explained: How Smart Money Targets Stops
A stop hunt is a price move that pushes into a zone where stop-loss orders are clustered, triggering them — often just before price reverses. It works because stops are resting orders that convert to market orders when hit, creating a concentrated burst of buying or selling that larger participants can trade against. This guide explains the real mechanics of stop loss hunting, separates fact from hype, and shows where stops tend to cluster and how traders think about placing them.
What a stop hunt actually is
When you set a stop loss, you place a resting order at a specific price. The moment price touches that level, a standard stop converts to a market order — it executes at the next available price, which in fast or thin conditions may be worse than the level you set. Now imagine hundreds of traders parking stops in the same narrow zone. When price reaches it, those stops fire together as market orders. That sudden cluster of orders is liquidity, and it is the whole point.
Stops resting above a high act as buy orders (buy-side liquidity); stops below a low act as sell orders (sell-side liquidity). A large participant who wants to buy a sizeable position needs sellers to fill against — which is exactly what a pool of sell-stops below an obvious low provides once triggered. A stop hunt is simply price reaching for that pool. The chart signature is often a single sharp wick beyond an obvious level, a volume spike that fades, and a quick snap-back — though none of these confirm anything on their own.
Why stops are predictable — not spied on
The framing matters here. Large players generally do not see your individual stop order sitting on a screen. What they can infer is where stops tend to cluster, because many traders follow the same playbook and place stops in the same obvious places. It is pattern inference from crowd behaviour, not surveillance.
This is not only an SMC talking point — price clustering at round numbers has been documented in academic research going back decades: orders genuinely concentrate at whole numbers, halves and quarters. Studies of round-number trading have estimated it produces a large aggregate wealth transfer in US equities each year. So stops bunching at predictable prices is a real, measurable effect, independent of any 'smart money' narrative.
Where stops tend to cluster
- Just beyond prior swing highs and swing lows
- Equal highs and equal lows (double tops and bottoms) — a common target in ICT-style analysis
- Psychological round numbers (for example 1.1000 on EUR/USD, or 2000.00 on gold)
- Prior day, prior session and prior week highs and lows
- Just past obvious support, resistance and trendlines
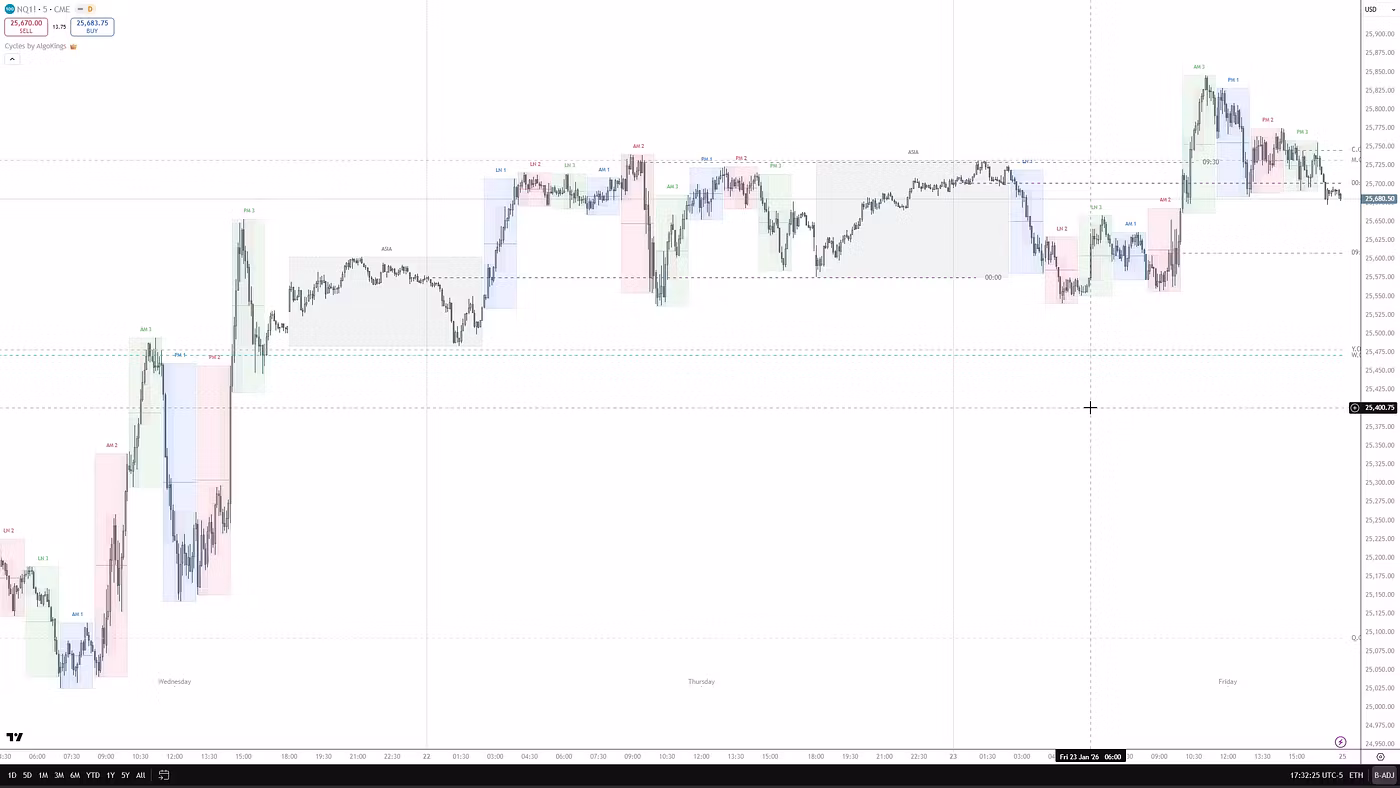
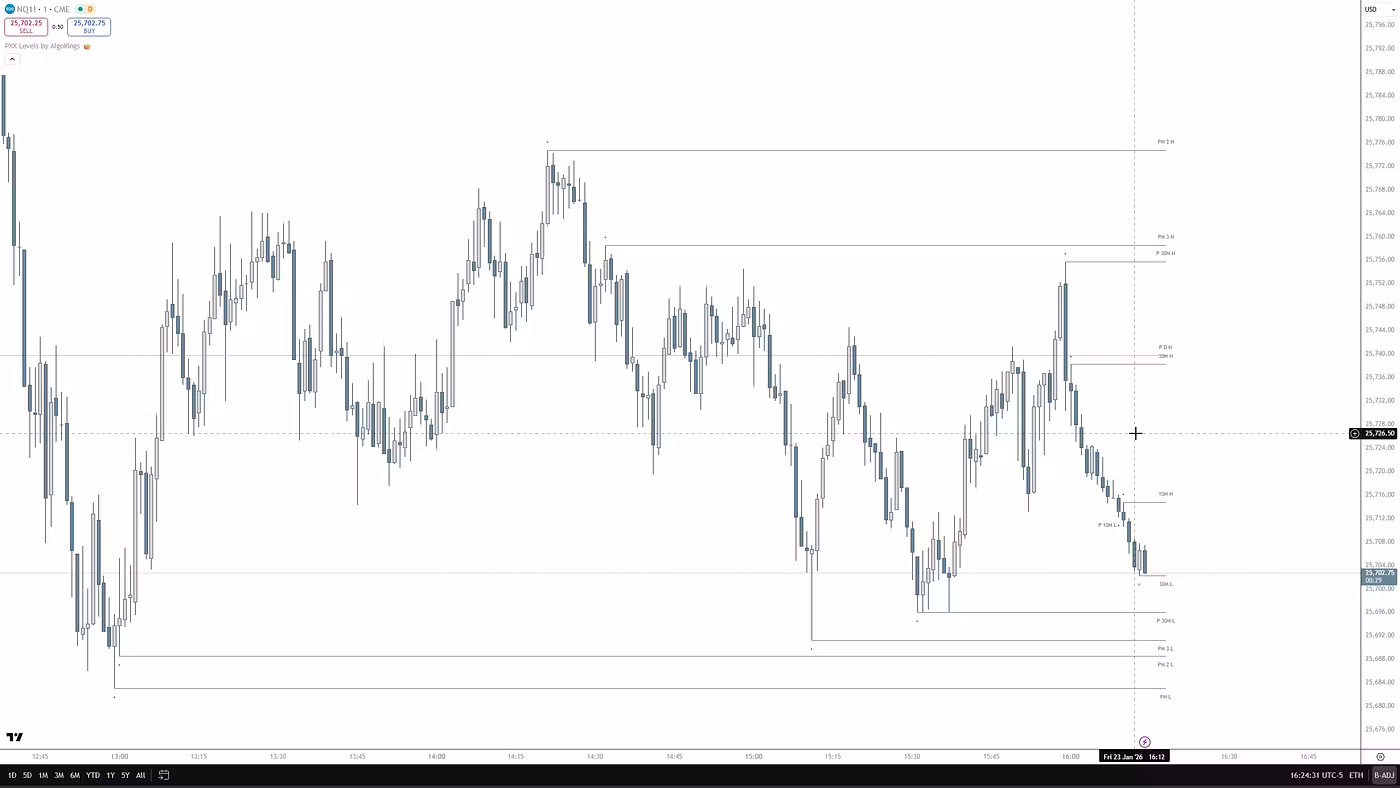
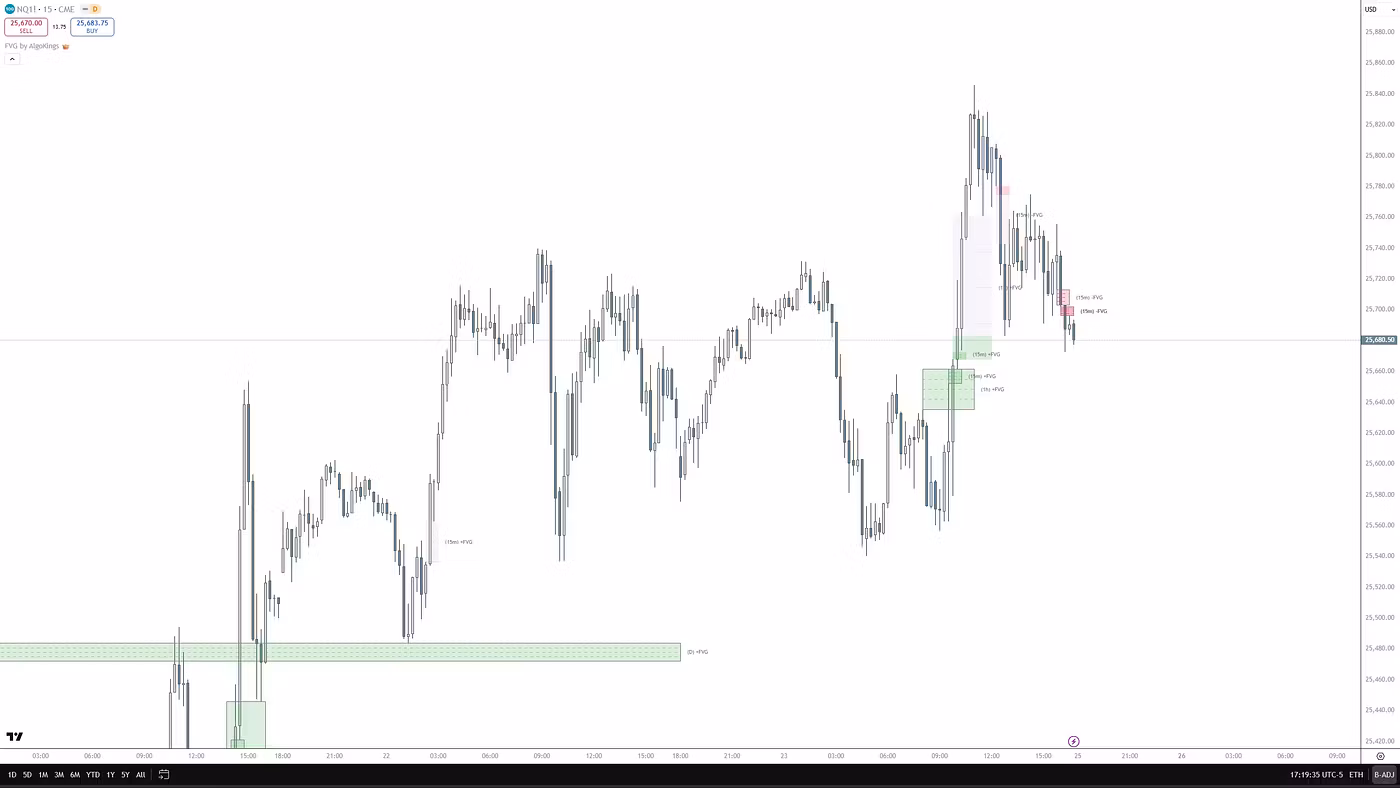
The idealised sequence: price drifts toward a liquidity pool, spikes through it to trigger stops (and traps breakout traders who entered on the break), the burst of orders helps fill a larger position, then price either reverses or continues. Tools like AlgoKings' PXX Levels mark prior-day and session highs and lows so you can see these pools before price reaches them, and an FVG indicator highlights the imbalances, or fair value gaps, left behind after a sharp displacement.
Stop hunt vs. liquidity sweep
These two terms are often used loosely, and many traders treat them as near-synonyms. Where people do draw a line, it is usually this: a stop hunt emphasises the intent and effect — triggering crowded stops, frequently as a short-lived spike that snaps back. A liquidity sweep emphasises the mechanical action — a run that takes out resting liquidity beyond a level. The distinction is a convention, not a strict rule, and the same event can be called either.
What matters more than the label is what happens next. A sweep can resolve in either direction: sometimes price reverses (the classic liquidity-grab-then-reverse idea), and sometimes it carries on in the same direction as a continuation. Neither outcome is guaranteed by the sweep itself. The common error is assuming 'a level got swept, therefore it reverses' — or the opposite — without confirmation. Reading the move against the higher-timeframe trend, rather than the lower-timeframe wick alone, is how most SMC traders try to tell the two apart.
Is it manipulation? And do brokers hunt your stop?
On regulated, exchange-traded markets, the idea that your specific stop is being personally targeted is largely a myth. The genuine conflict-of-interest concern sits with unregulated dealers that take the other side of client trades (a 'B-book' model) and so can profit when clients lose. The reasonable lesson there is about broker choice and regulation — not that every stop you place is a target.
It is also worth separating mechanics from framework. The mechanics — stops becoming market orders, orders clustering at round numbers, thin liquidity producing wicks, dealing-desk brokers carrying conflicts of interest — are well established. There is even a recognised academic concept, 'predatory trading' (the term used in finance research for how participants can exploit others' forced liquidation). But the fuller SMC/ICT model — order blocks, fair-value-gap entries, 'engineered liquidity' — is an interpretive framework many traders use to read these moves, not proven mechanics. It is best treated as a lens, not a law.
Common mistakes and misconceptions
- Confusing normal volatility with deliberate manipulation. Many moves labelled 'stop hunts' are ordinary liquidity-driven wicks, news spikes or thin-session moves — not a coordinated raid.
- Entering right at the obvious level. Doing so simply adds you to the liquidity pool. Many SMC traders wait for a sweep plus a reversal signal rather than trying to predict the spike.
- Setting stops so wide they 'cannot be hit.' A stop that is too wide just enlarges the potential loss and distorts the risk-to-reward — no placement makes a position immune.
- Removing stops entirely. That trades an occasional clip for effectively unbounded risk.
- Treating stop hunts as a guaranteed edge. Spotting one after the fact on a chart is easy; reading it in real time is probabilistic, never certain.
How traders think about stop placement
No stop can be made un-hittable, but the most obvious pools can be avoided. Common approaches discussed in SMC circles include placing stops by volatility (for example, a multiple of ATR) or by market structure — beyond a swing point rather than one tick past it, where the crowd's stops tend to sit. The point that hype content often omits is that placement is only half the picture: position sizing determines how much a single stop-out actually costs. When each trade risks a small, fixed fraction of an account, an occasional clip is a survivable event rather than a serious one. Stop placement governs where a position exits; position sizing governs whether one exit can do real damage. None of this is a recommendation — it is how the trade-offs are usually described.
Seen this way, liquidity-mapping tools are analytical aids, not signals. AlgoKings' SMC package and PXX Levels are designed to show where pools sit and where price has already swept — they describe market structure; they do not predict outcomes or tell you when to enter.
Frequently asked questions
What is stop-loss hunting and how does it actually work?
Stop-loss hunting is when price moves into a zone of clustered stop orders and triggers them. Because a standard stop converts to a market order when hit, a cluster of them creates a burst of buying or selling — liquidity that larger participants can fill positions against. The classic pattern is a spike through an obvious level followed by a reversal, but that outcome is never guaranteed.
Can brokers or market makers see and target my personal stop loss?
On regulated, exchange-traded markets, your individual stop generally is not visible or personally targeted — larger players infer where stops cluster from crowd behaviour, not from watching your screen. The genuine conflict-of-interest concern is with unregulated 'B-book' dealers that profit when clients lose. The practical takeaway is to consider a well-regulated broker, rather than to assume every stop is a target.
What's the difference between a stop hunt and a liquidity sweep?
The terms are often used interchangeably. Where a distinction is drawn, a stop hunt emphasises the intent — triggering crowded stops, often a short-lived wick that snaps back — while a liquidity sweep emphasises the mechanical run that takes out resting liquidity beyond a level. The distinction is a convention, not a strict rule, and a sweep can be followed by either a reversal or a continuation, so direction has to be confirmed rather than assumed.
How can a stop loss be placed so it's less likely to get hunted?
The most obvious clusters can be avoided — for example, not sitting one tick beyond a swing high, an equal high or low, or a round number. Volatility-based (ATR) or structure-based placement beyond a swing point is one common approach. No placement is immune, which is why traders often emphasise position sizing: keeping each trade's risk to a small fixed fraction of the account so that an occasional clip stays survivable. This is descriptive, not a recommendation.
Is stop hunting illegal market manipulation?
Mostly no. On regulated exchanges, price reaching for clustered liquidity is normal market behaviour, and round-number clustering is academically documented. Finance research recognises a concept called 'predatory trading' that exploits forced liquidation, but the everyday SMC version — 'smart money traps retail' — is largely an interpretive framework rather than proven illegal activity. Outright manipulation does exist, but it is the exception, not the rule.
Can you trade with stop hunts, and is it reliable?
Some traders do, typically by waiting for a sweep of an obvious level followed by a reversal signal rather than predicting the spike in advance. It is a probabilistic approach, not a guaranteed edge — identifying a hunt after the fact is easy, but reading it live carries real risk. Liquidity-mapping tools are best treated as analytical aids, not signals, and any approach should be paired with risk management. This is educational information, not financial advice.
Risk disclosure
AlgoKings provides technical analysis indicators and educational material for informational purposes only. Nothing on this website is financial, investment or trading advice. Trading financial instruments carries a high level of risk and may not be suitable for every investor; you can lose some or all of your capital. Indicators do not predict future price movements and do not guarantee any outcome. You are solely responsible for your own trading decisions and risk management. Past performance is not indicative of future results.