Equal Highs and Lows (Liquidity) Explained
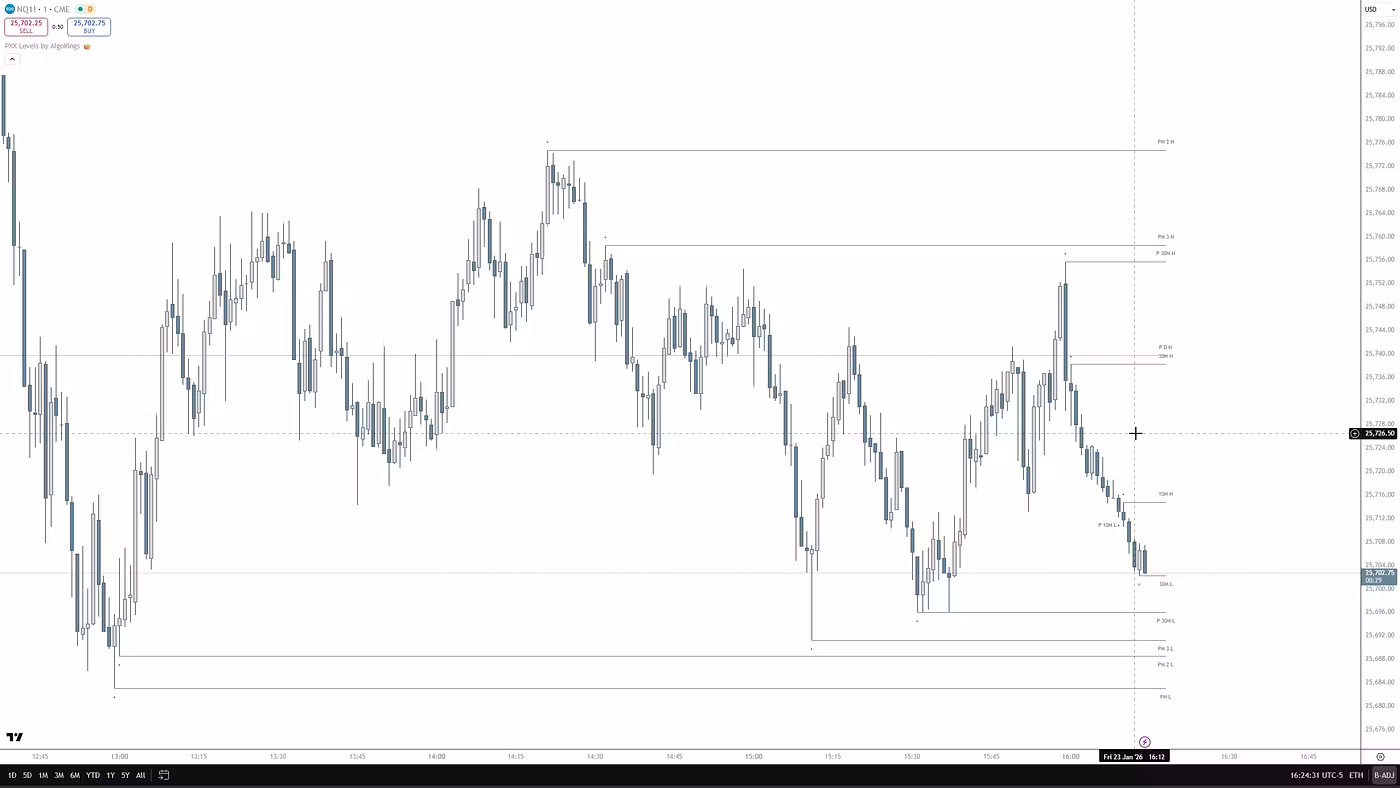
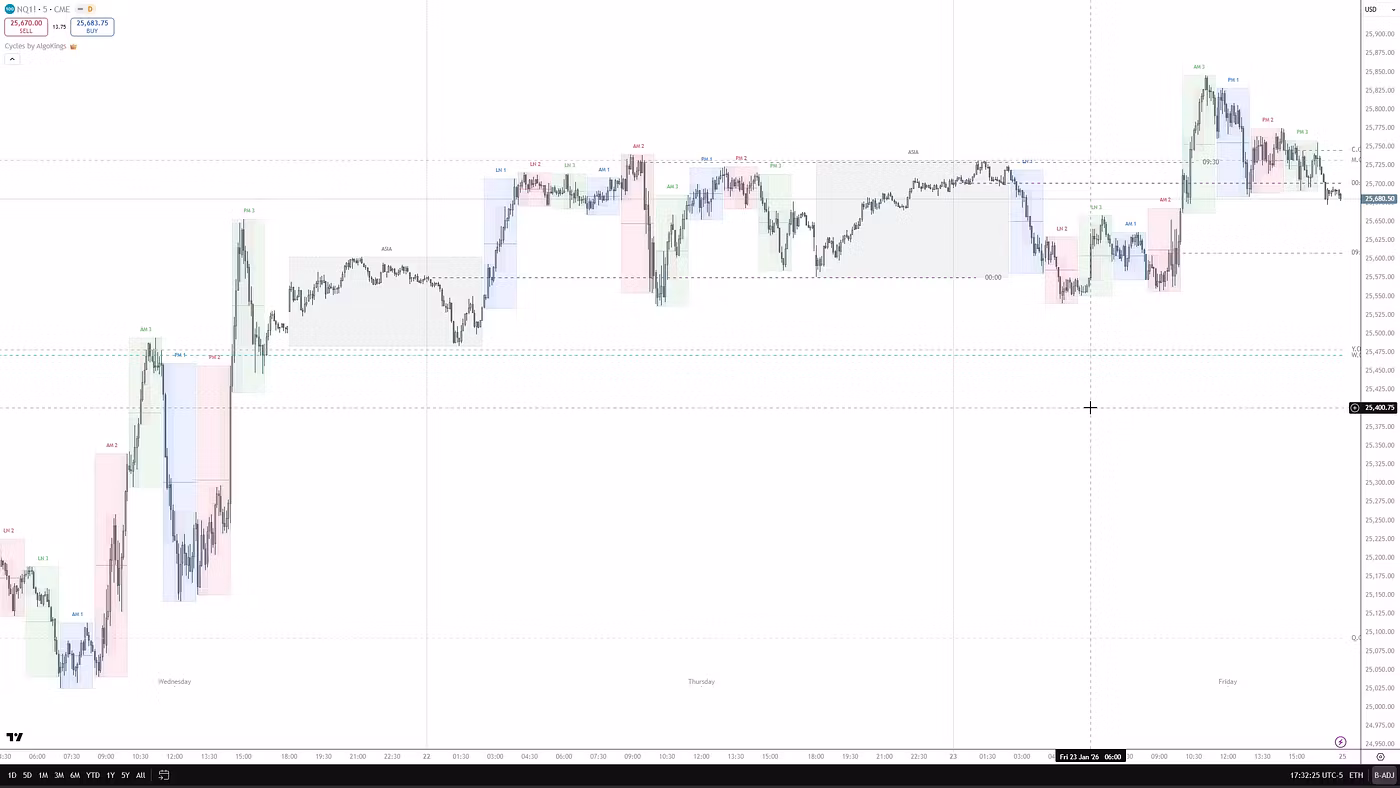
Equal highs (EQH) and equal lows (EQL) are two or more swing highs or lows that print at roughly the same price, forming a horizontal level where stop and breakout orders cluster — making them pools of resting liquidity that price is often drawn to sweep before reversing. In Smart Money Concepts (SMC) and ICT, they are treated not as guaranteed turning points but as obvious levels that mark where liquidity rests.
When price taps the same high twice and stalls, traders place buy-stop orders just above it — both stop-losses from shorts and breakout entries from longs. The same happens in reverse below a double bottom. Those clustered orders are liquidity, and larger participants need liquidity to fill size without heavy slippage. That is why equal highs and lows so often get run through before price turns.
EQH vs EQL: buy-side and sell-side liquidity
The two are mirror images. Equal highs sit above price and hold buy-side liquidity — the buy-stops resting above resistance. Equal lows sit below price and hold sell-side liquidity — the sell-stops resting below support. A move up through equal highs takes buy-side liquidity; a move down through equal lows takes sell-side liquidity. Naming which side you are watching keeps your bias clear.
How to identify them (and the equality threshold)
Equal highs and lows are read from confirmed swing pivots, not from every candle. In practice the two highs are rarely identical to the tick, so traders allow a small tolerance — often called an equality threshold — within which the levels count as 'equal.' Focus on clean, significant pivots on a timeframe you actually trade; marking every minor wobble on a low timeframe just produces noise.
Are they just support and resistance?
They look like horizontal support and resistance, but the read is different. Traditional support/resistance assumes the level should hold. The EQH/EQL framing assumes the opposite is likely: the level is so obvious that the liquidity behind it is engineered to be taken. The expectation is a sweep through the level, followed by a reaction — not a clean bounce off it.
How traders approach equal highs and lows
- Many traders mark significant equal highs/lows and note which liquidity (buy-side or sell-side) sits beyond them.
- They wait for the sweep: a spike through the level that fails to hold, often leaving a long rejection wick.
- They look for confirmation before acting — a rejection candle, displacement, or a shift in market structure back the other way.
- Entries are commonly taken on the retest or pullback after confirmation, rather than on the spike itself.
- Stops are typically placed beyond the sweep's extreme, not just inside the level where liquidity is engineered to be taken.
- Targets are often defined at the opposite liquidity pool or an unfilled fair value gap, with higher-timeframe context weighed before committing.
Common mistakes to avoid
The biggest error is treating equal highs/lows as guaranteed reversals and trading them blindly. A close beyond the level is just as often a sweep that snaps back as a real breakout — the difference shows up in follow-through, so wait to see whether momentum sustains and the retest holds. Avoid resting your stop right above equal highs or below equal lows; that is exactly where stops get taken. And 'liquidity' does not mean one manipulator is hunting you personally — it simply describes the structural reality that orders cluster at obvious levels. Used without higher-timeframe bias or confluence, these setups are lower probability.
Frequently asked questions
What are equal highs and equal lows in trading?
They are two or more swing highs (equal highs) or swing lows (equal lows) that form at approximately the same price, creating a horizontal level. Stop and breakout orders cluster just beyond them, so they act as pools of resting liquidity that price often sweeps before reversing.
Do equal highs and lows have to be exactly equal?
No. Exact tick-for-tick matches are rare. Traders allow a small tolerance — an equality threshold — within which the highs or lows count as equal. The cleaner and more significant the pivots, the more meaningful the level.
How do I tell a liquidity sweep from a real breakout?
A sweep pierces the level briefly, fails to hold (often with a long wick) and reverses; a genuine breakout sustains momentum beyond the level and holds on the retest. Waiting for that follow-through and a confirmation signal is what separates the two — there is no guaranteed read in advance.
Risk disclosure
AlgoKings provides technical analysis indicators and educational material for informational purposes only. Nothing on this website is financial, investment or trading advice. Trading financial instruments carries a high level of risk and may not be suitable for every investor; you can lose some or all of your capital. Indicators do not predict future price movements and do not guarantee any outcome. You are solely responsible for your own trading decisions and risk management. Past performance is not indicative of future results.