Accumulation, Manipulation, Distribution (AMD)
Accumulation, Manipulation, Distribution (AMD) is a price-action framework describing three repeating phases that smart-money concepts attribute to institutional activity: a quiet range (accumulation), a false breakout that sweeps liquidity (manipulation), and the real directional move (distribution). It is the analytical core of the ICT "Power of Three" model and a modern simplification of Richard Wyckoff's century-old work on supply and demand.
The three phases of AMD
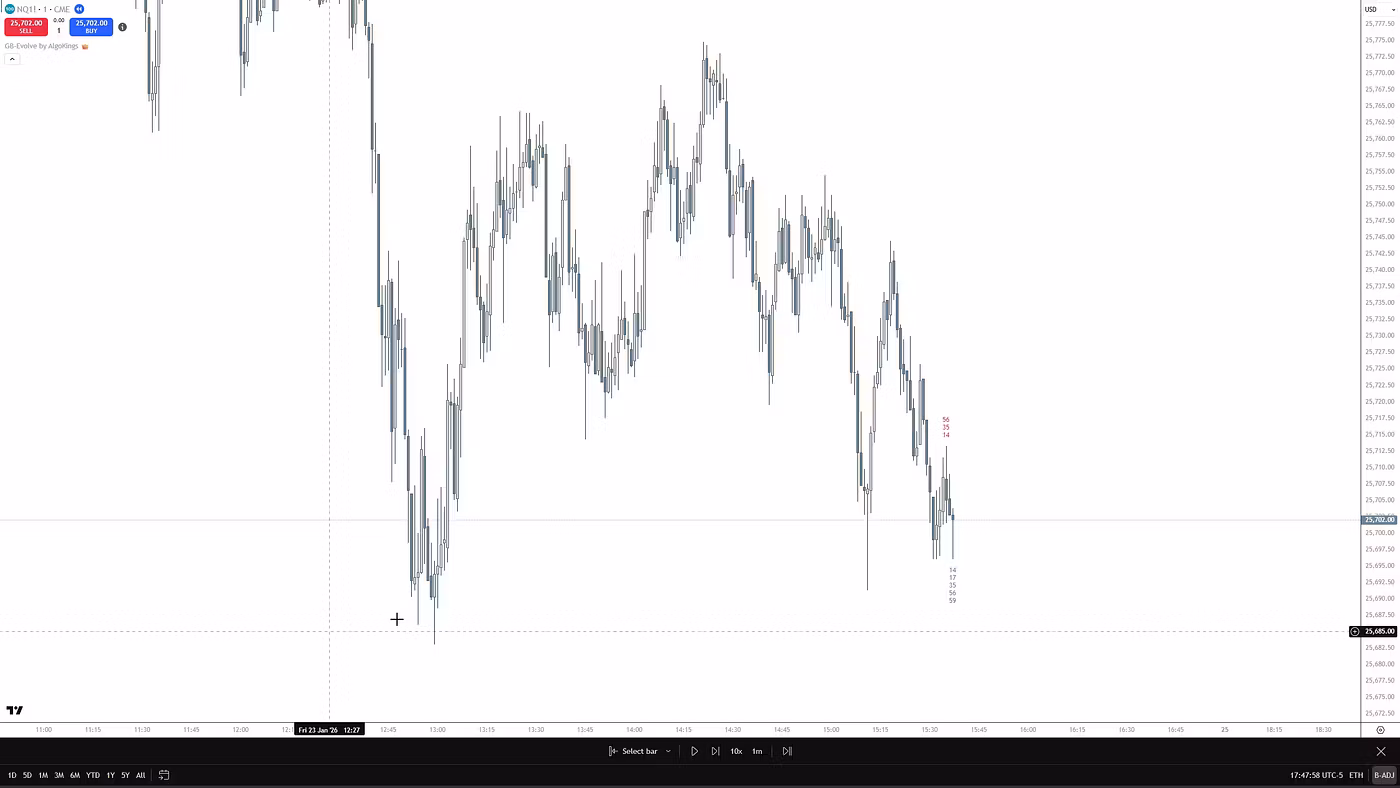
AMD breaks a market cycle into three sequential phases. Phase 1, accumulation, is a tight sideways range with low volatility and small, overlapping candles, the idea being that large participants build positions while resting orders (stops) cluster above and below the range. Phase 2, manipulation, is a sharp false move out of that range, often called the 'Judas Swing,' that runs those clustered stops before reversing. Phase 3, distribution, is the genuine, sustained move in the opposite direction, typically accompanied by a strong displacement candle, rising participation, and Fair Value Gaps left behind as price travels.
- Accumulation: coiling range, low volume/volatility, liquidity building on both sides.
- Manipulation: the Judas Swing, a stop-hunt or news spike that breaks the range and traps breakout traders.
- Distribution: displacement and the real trend, where the move actually follows through.
AMD, ICT Power of Three, and Wyckoff
AMD and the ICT 'Power of Three' (PO3) describe essentially the same three-phase model; PO3 was popularised by Michael Huddleston (the Inner Circle Trader). The concept is widely recognised as a relabelled, simplified version of Richard Wyckoff's early-1900s schematics on accumulation and distribution and his law of supply and demand. None of these are proprietary, guaranteed systems, and AMD should not be confused with the lagging Accumulation/Distribution (A/D) volume oscillator, which is a separate indicator that happens to share part of the name.
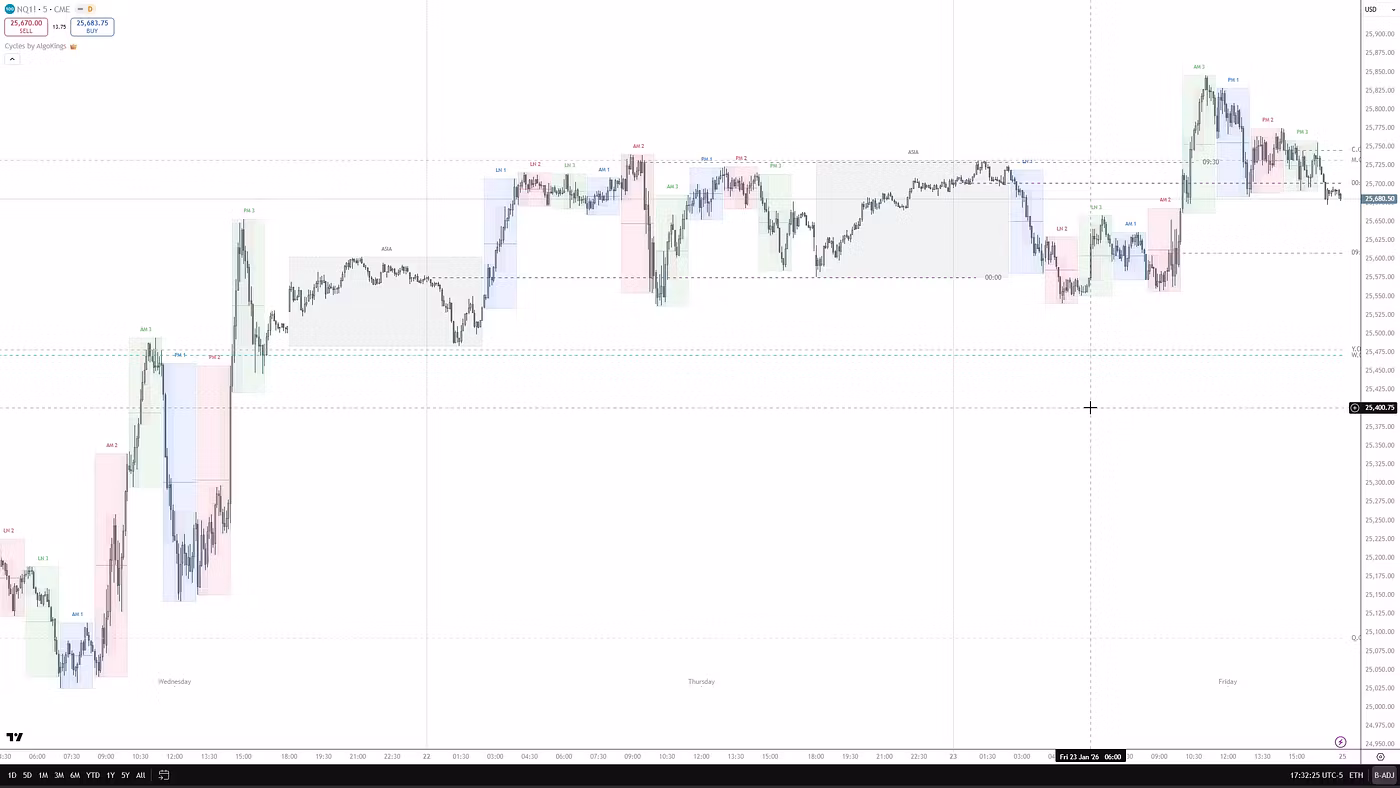
Sessions, timeframes, and the fractal nature
AMD is often mapped onto trading sessions: the Asian session as accumulation, the London session as manipulation, and the New York session as distribution. Because your platform shows broker server time, the same hours can appear shifted on your chart, so it is worth confirming when each killzone actually falls for your data feed. The pattern is also fractal, repeating on the daily candle and within intraday timeframes (15m, 5m, 3m), which is why traders look for a higher-timeframe context before zooming in.
How traders read an AMD setup
The common approach is to define a higher-timeframe (often daily) directional bias first, then drop to a lower timeframe and watch for the manipulation phase to sweep liquidity against that bias before reversing into distribution. The studied entry is the reversal from manipulation into distribution, in line with the higher-timeframe direction, not the breakout itself. Market-structure shifts, order blocks, and the filling of Fair Value Gaps are used as confluence for the phase transition. This is analysis, not a buy/sell signal: phases are frequently messy, nested, or skipped, the model carries no guarantee of accuracy, and any application should sit inside a disciplined risk-management plan.
Common pitfalls
- Treating the first big move out of the range as the real trend, when it is usually the manipulation trap.
- Chasing the breakout instead of waiting for the reversal into distribution.
- Ignoring higher-timeframe bias and trading every range in isolation.
- Misreading session times because of broker server time vs your local time.
- Over-leveraging on the manipulation candle out of FOMO, which is the exact reaction the phase tends to provoke.
Frequently asked questions
What does AMD stand for in trading?
AMD stands for Accumulation, Manipulation, Distribution, a three-phase price-action framework from smart money concepts: a quiet range, a false breakout that sweeps liquidity, and the real directional move that follows.
Is AMD the same as the ICT Power of Three (PO3)?
Essentially, yes. The ICT 'Power of Three' is the accumulation-manipulation-distribution cycle popularised by Michael Huddleston (the Inner Circle Trader); AMD and PO3 are commonly used interchangeably to describe the same three-phase logic.
Which phase of AMD do traders actually focus on?
Most AMD analysis focuses on the reversal from manipulation into distribution, aligned with a higher-timeframe bias, rather than the manipulation sweep itself. The breakout is viewed as the trap, not a confirmation, and this remains analysis rather than a buy/sell signal.
Risk disclosure
AlgoKings provides technical analysis indicators and educational material for informational purposes only. Nothing on this website is financial, investment or trading advice. Trading financial instruments carries a high level of risk and may not be suitable for every investor; you can lose some or all of your capital. Indicators do not predict future price movements and do not guarantee any outcome. You are solely responsible for your own trading decisions and risk management. Past performance is not indicative of future results.