Smart Money & ICT Trading Glossary: Terms and Abbreviations Explained
This smart money concepts glossary defines the ICT trading terms and abbreviations you keep running into — FVG, BOS, CHoCH, OTE, PO3 and the rest — in one or two plain-English sentences each. If you just want the quick answers, what does FVG mean and what does BOS mean are covered in the FAQ at the end. These terms come mostly from the Inner Circle Trader (ICT) and the wider Smart Money Concepts (SMC) community, and they are discretionary ways of reading a chart, not proven mechanical edges. Use them as a shared vocabulary and a lens, not a promise about what price will do.
Most of the trading abbreviations explained below describe how 'smart money' (large institutions) is assumed to act — seeking liquidity, breaking structure, leaving imbalances. That narrative is an interpretive model: there is no public proof that banks place orders at these exact zones, and definitions vary between educators. Where a term is contested, we say so. Treat everything here as educational context, not financial advice.
Market structure
Smart Money Concepts (SMC)
An umbrella approach that reads charts the way large 'smart money' institutions are assumed to act — tracking liquidity, market structure and price imbalances instead of classic indicators. ICT is its best-known branch.
Inner Circle Trader (ICT)
Both a person (Michael J. Huddleston) and the specific methodology and vocabulary he teaches — FVGs, order blocks, killzones, PO3 and more. Most terms in this glossary are ICT terminology.
Market Structure
The sequence of swing highs and swing lows that tells you whether a market is trending up (higher highs and higher lows), down (lower highs and lower lows) or ranging. It is the reference frame for almost every other concept here.
Break of Structure (BOS)
Price breaks beyond the most recent swing point in the direction of the existing trend — a new higher high in an uptrend, or a new lower low in a downtrend. It is read as trend continuation.
Change of Character (CHoCH)
The first break of structure against the prevailing trend — for example, taking out the last higher low in an uptrend. It is treated as an early warning of a possible reversal, not confirmation of one.
Market Structure Shift (MSS)
Closely related to CHoCH: a counter-trend break backed by strong displacement, read as firmer evidence a reversal is underway. Many traders use MSS and CHoCH interchangeably, so check how a given educator defines each.
Displacement
A strong, fast, one-directional move of large-bodied candles that signals aggressive intent and usually creates a fair value gap. It is used to validate a BOS, an MSS or an order block.
Liquidity
Liquidity
Clusters of resting orders — mostly stop-losses and pending orders — that the market can move toward to fill. The central organising idea of SMC is that price 'seeks liquidity'.
Buy-Side Liquidity (BSL)
Buy stops resting above old highs (short-sellers' stops plus breakout buy orders). It sits above the market; reaching up into it lets large sellers fill.
Sell-Side Liquidity (SSL)
Sell stops resting below old lows (longs' stops plus breakout sell orders), so it sits below the market. A common beginner error is assuming buy-side sits below — it does not.
Internal vs External Liquidity
External liquidity is the obvious swing highs and lows at the edges of a range; internal liquidity is the pools inside it, such as fair value gaps and minor highs and lows. Price is often described as rotating between the two.
Liquidity Sweep
Price briefly trades through a liquidity level — for example spiking above an old high — triggers those orders, then reverses. The 'sweep' is the act of running the stops.
Liquidity Grab
Effectively a synonym for a sweep, often used for a quick wick through a level followed by rejection. Many traders use sweep, grab and raid interchangeably.
Inducement (IDM)
A 'trap' level — a minor high or low that lures traders to enter or place stops, which smart money is assumed to sweep first to fund the real move. It is often the liquidity taken just before a valid order block.
Equal Highs / Equal Lows (EQH / EQL)
Two or more highs (EQH) or lows (EQL) at almost the same price. They resemble double-tops or double-bottoms and so concentrate stops, making them prime liquidity targets.
Stop Hunt
The narrative that price is deliberately driven into a cluster of stops to trigger them before reversing. Treat it as an interpretation of price action, not an established fact.
Imbalance & gaps
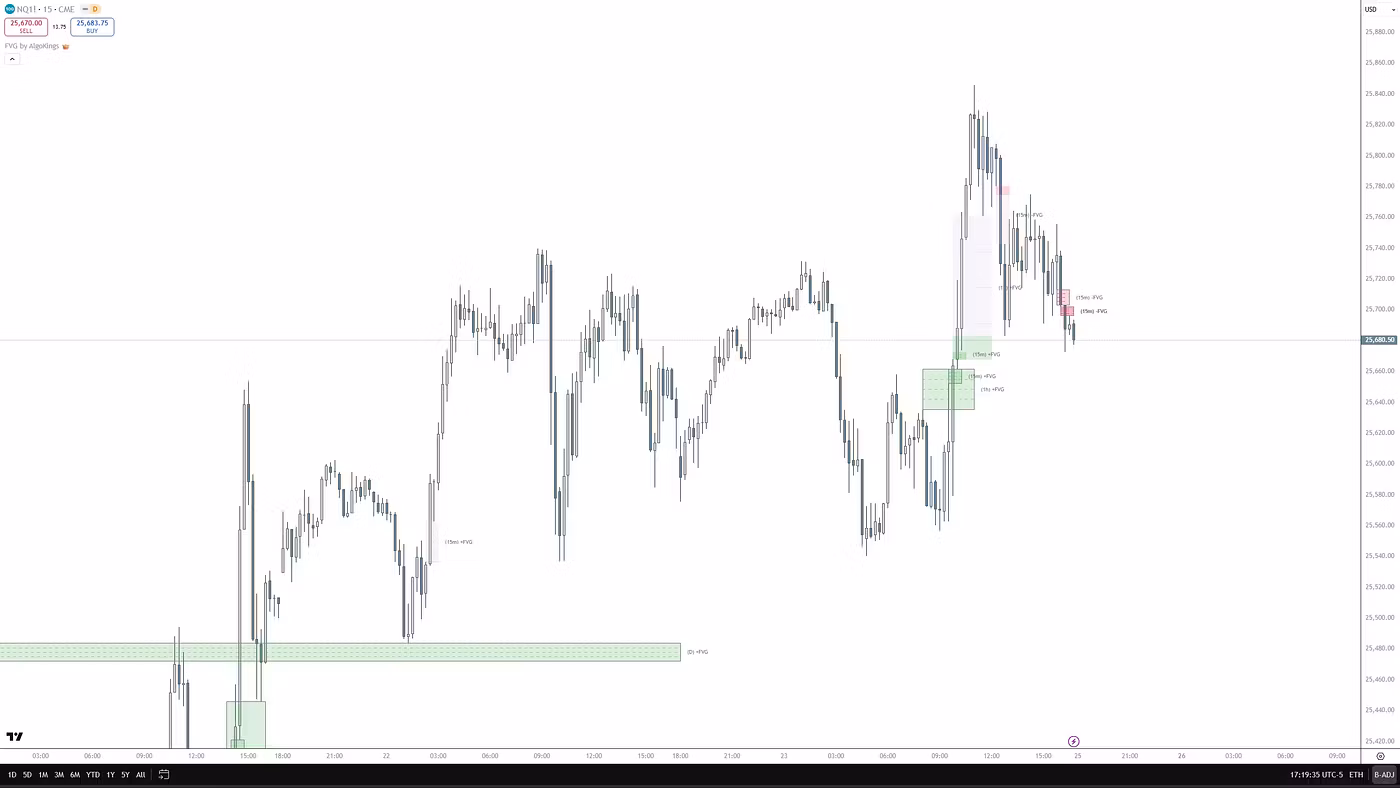
Fair Value Gap (FVG)
A three-candle pattern in which a strong middle (displacement) candle moves so fast that it leaves a gap: the wick of candle one and the wick of candle three do not overlap, leaving an unfilled range between them. It is read as an imbalance that price often — not always — returns to rebalance.
Inversion Fair Value Gap (IFVG)
An FVG that price has traded through and closed beyond on a candle body, flipping its polarity — a failed bullish FVG becomes bearish resistance, and vice versa. A mere wick poke does not count; it needs a body close.
Imbalance
The general term for any inefficient, one-sided move that leaves a price area only partly traded; an FVG is its most common form. 'Inefficiency' is used as a synonym.
Balanced Price Range (BPR)
A zone where a bullish FVG and a bearish FVG overlap — price delivered both up and down through the same area — creating a dense support or resistance pocket traders watch for reactions.
Entries & zones
Collectively ICT calls the tools in this section PD Arrays (Premium and Discount Arrays). They mark locations and context, not signals to act on by themselves.
Order Block (OB)
The last opposing candle (or cluster) before a displacement move that breaks structure — for example the last down candle before a strong rally. It is treated as a zone institutions may defend if price returns, and is most often used as a continuation tool.
Breaker Block (BB)
A failed order block that 'flips'. After an order block is violated and structure shifts the other way, the old zone is re-used as opposite-direction support or resistance — a reversal-oriented tool.
Mitigation Block (MB)
An old order block or unmitigated swing that price returns to, respects, then continues in the same direction as the original move. Unlike a breaker (where structure flipped), a mitigation block is a continuation tool (structure did not).
Rejection Block
A zone built from the wicks — not the bodies — at a swing extreme where price was sharply rejected; that wick area is watched as future support or resistance. It is the least standardised of the block family.
Premium and Discount
Measured from the 50% midpoint of a chosen range: premium is above it (the 'expensive' half, where SMC traders look to sell) and discount is below it (the 'cheap' half, where they look to buy). It is the SMC framing of buy low, sell high.
Equilibrium
The exact 50% midpoint of a dealing range — the boundary between premium and discount, treated as 'fair value'.
Optimal Trade Entry (OTE)
A location rather than a signal: the deeper part of a Fibonacci retracement of an impulse leg, commonly the 62%-79% zone (with 70.5% often highlighted as the 'sweet spot'), where traders look to enter on the pullback. It is meant to be combined with structure and liquidity, not used alone.
Time & Goldbach
Power of Three (PO3)
The ICT model that a candle or session builds in three stages — accumulation, then manipulation, then distribution. It is called the power of three because every higher-timeframe candle is said to contain this three-phase delivery.
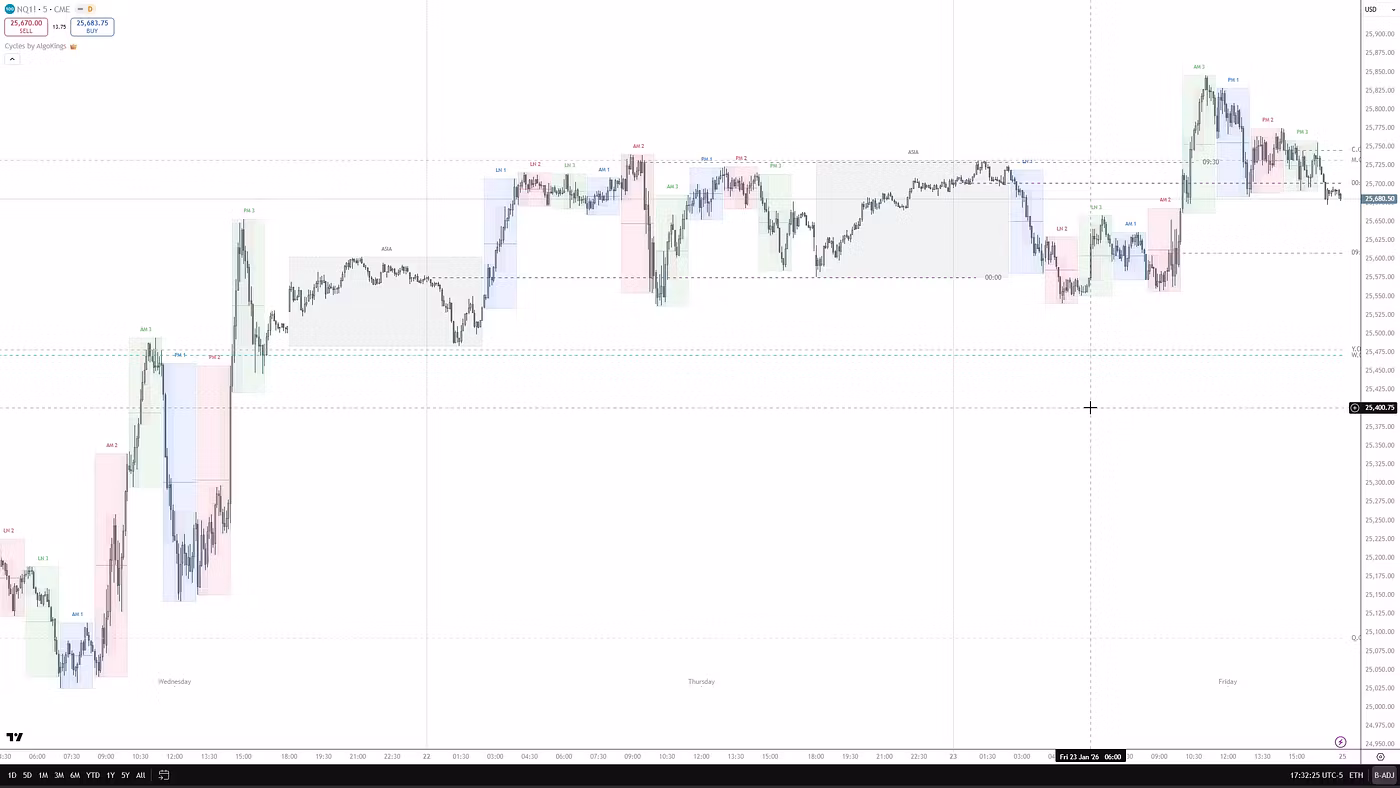
Accumulation-Manipulation-Distribution (AMD)
The three phases PO3 describes: accumulation (tight ranging near the open while positions build), manipulation (a false move against the true direction that sweeps stops), and distribution (the real, larger move). Traders treat mainly the distribution leg as the one they want to be positioned for.
Judas Swing
The deceptive early move — the manipulation phase of AMD — usually near a session or day open, that pushes one way to grab liquidity before reversing into the real move. It is named after the betrayal.
Killzone
Specific high-activity windows (roughly two to four hours) when ICT expects the most liquidity-driven moves — the London, New York AM, London Close and Asian sessions. Exact hours are approximate and depend on your timezone and daylight saving.
Silver Bullet
A narrow one-hour window inside a killzone where traders look for an FVG entry. Three are taught in New York time — roughly 03:00-04:00, 10:00-11:00 and 14:00-15:00 — with the 10:00-11:00 AM window the most widely cited.
Dealing Range
The current swing-high-to-swing-low span in play: its high is treated as buy-side liquidity, its low as sell-side, and its 50% as equilibrium. It is the frame for measuring premium and discount and drawing Fibonacci levels.
IPDA (Interbank Price Delivery Algorithm)
ICT's concept of an unseen algorithm that 'delivers' price toward liquidity and imbalance. In practice traders apply its 20-, 40- and 60-trading-day lookback windows to mark recent highs and lows; it is a conceptual model, not a documented exchange mechanism.
Goldbach Levels
Price levels derived by treating a dealing range as a power of three (for example 27 for scalping or 243 for higher timeframes) and partitioning it, with certain percentage levels expected to coincide with order blocks, FVGs and breakers. The name nods to the Goldbach conjecture in number theory but does not give the method any mathematical validity.
Goldbach Numbers
The specific partition values inside a Goldbach-defined range that mark its levels, the basis of the framework's two 'algorithms'. It is a niche, esoteric overlay on top of ICT — usable as a partitioning method, with no peer-reviewed trading validity.
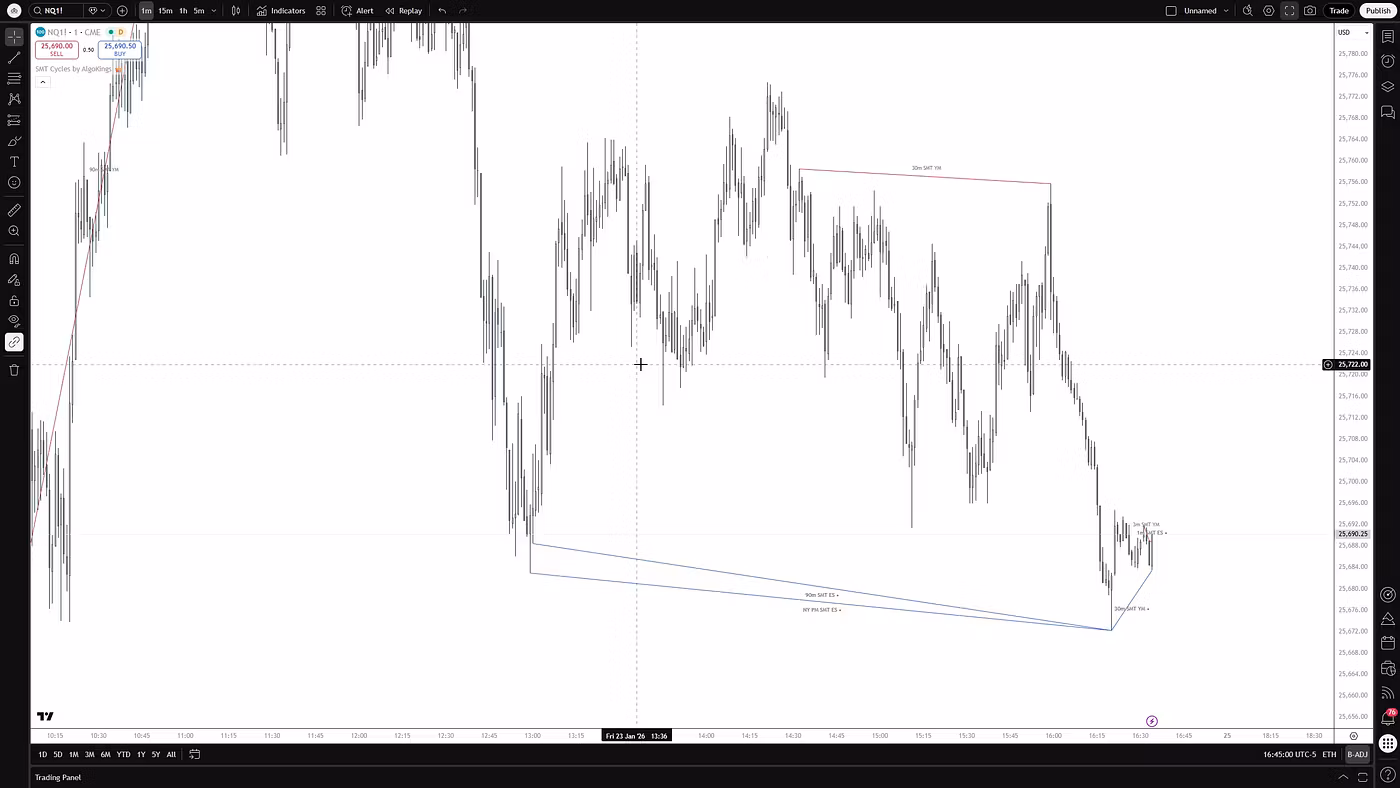
SMT Divergence
When two correlated instruments disagree at a key level — say EUR/USD makes a higher high while GBP/USD makes a lower high — read as a sign one market swept liquidity and a reversal may follow. 'SMT' usually expands to Smart Money Technique, though some sources write Tool or Trick.
How to use this glossary (and a caveat)
These terms give you a shared language for reading charts, but several have competing definitions — BOS, CHoCH and MSS, or order block, breaker and mitigation block, are not standardised across educators. 'Smart money', IPDA and stop hunts are interpretive narratives, not verified descriptions of how institutions trade, so avoid treating any of them as a guarantee that price will move a certain way.
- Learn structure first (BOS, CHoCH), then liquidity, then imbalance — most setups stack these in that order.
- Treat OTE, premium, discount and equilibrium as context and location, not as standalone entry signals.
- Remember that indicators only highlight these patterns; they do not confirm institutional activity.
- Approach Goldbach and PO3 after the core concepts feel comfortable — they are advanced overlays.
Frequently asked questions
What does FVG mean in trading?
FVG stands for Fair Value Gap: a three-candle imbalance where the wick of candle one and the wick of candle three do not overlap, leaving an unfilled gap that price often returns to rebalance.
What does BOS mean?
BOS stands for Break of Structure — price breaking a swing high or low in the direction of the existing trend, read as a sign the trend is continuing.
What does CHoCH mean, and how is it different from BOS?
CHoCH (Change of Character) is the first break of structure against the trend, hinting at a possible reversal. A BOS does the opposite: it breaks in the trend's direction and is read as continuation.
What does OTE mean?
OTE stands for Optimal Trade Entry — the deeper part of a Fibonacci retracement (commonly the 62%-79% zone, with 70.5% often highlighted) where traders look to enter a pullback, combined with structure and liquidity rather than used alone.
What does PO3 mean?
PO3 stands for the Power of Three: the model that a candle or session develops in three phases — accumulation, manipulation and distribution.
What does AMD mean in ICT?
AMD stands for Accumulation, Manipulation and Distribution — the three phases inside PO3. Accumulation builds positions, manipulation is a false move that sweeps stops, and distribution is the real move that traders aim to be positioned for.
Risk disclosure
AlgoKings provides technical analysis indicators and educational material for informational purposes only. Nothing on this website is financial, investment or trading advice. Trading financial instruments carries a high level of risk and may not be suitable for every investor; you can lose some or all of your capital. Indicators do not predict future price movements and do not guarantee any outcome. You are solely responsible for your own trading decisions and risk management. Past performance is not indicative of future results.