SMT Divergence Explained
SMT (Smart Money Technique) divergence is a price-action concept where two or more positively correlated instruments fail to confirm each other at a key swing point: one makes a new high or low while its partner does not. Popularized within ICT (Inner Circle Trader) methodology, it is read as a possible footprint of a liquidity sweep and is used as a confirmation tool, never as a standalone signal.
What SMT divergence actually is
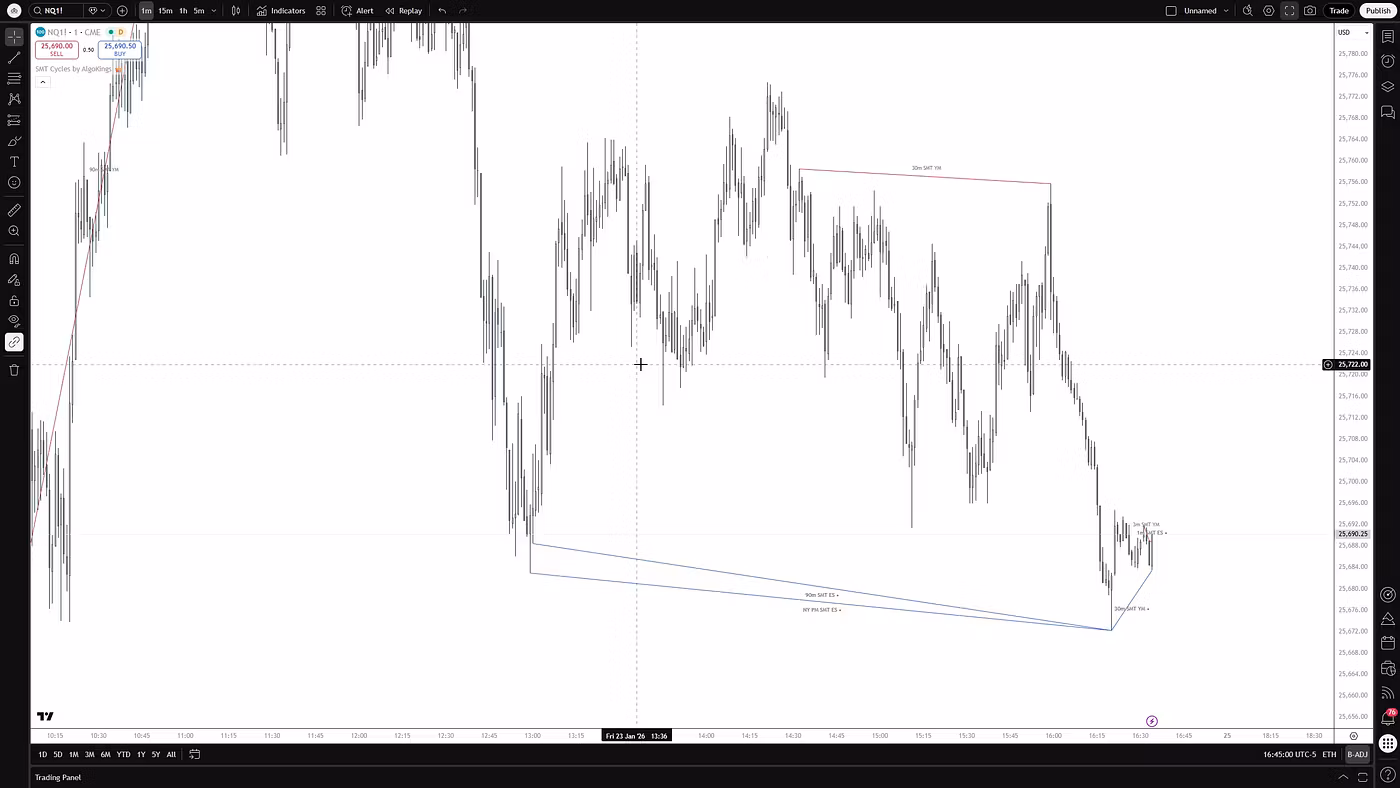
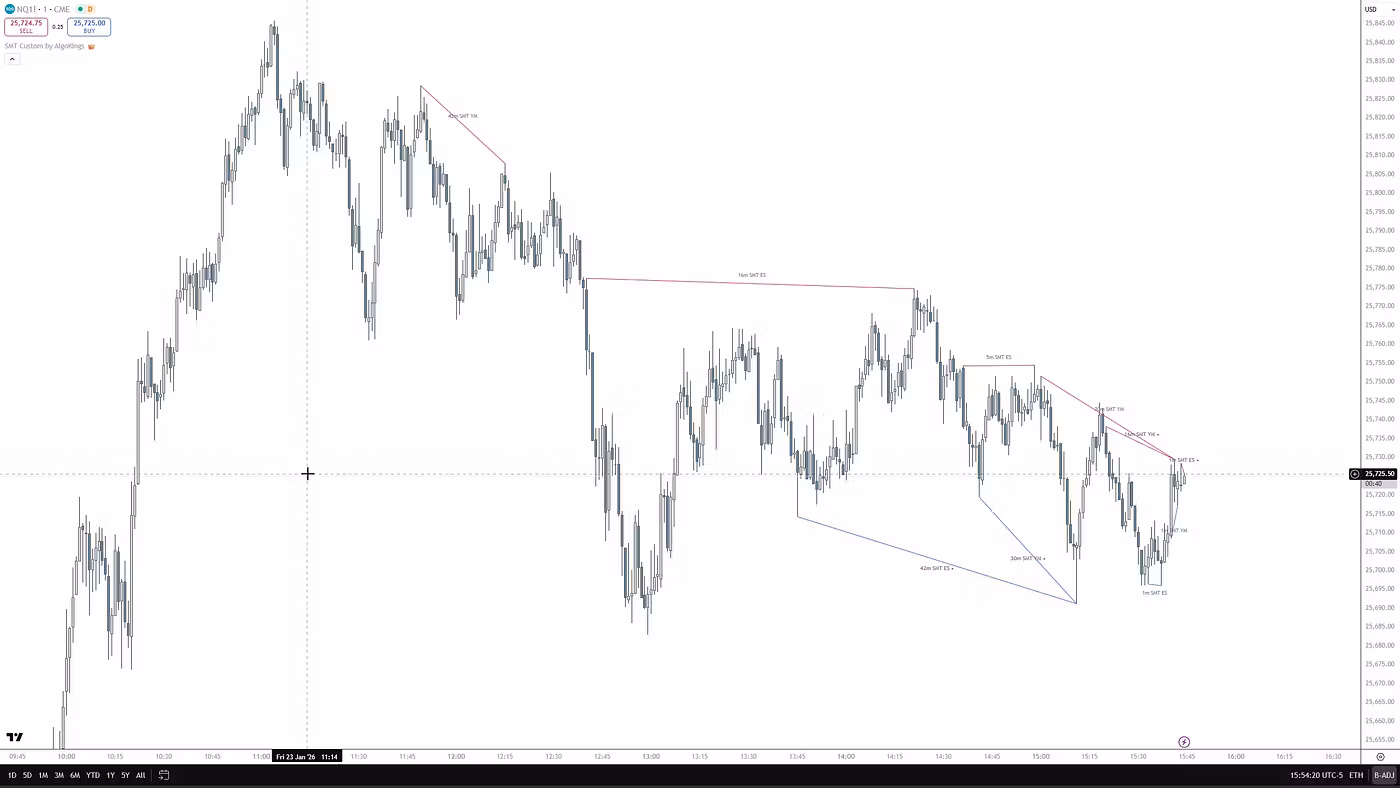
SMT stands for Smart Money Technique (the name is occasionally written differently, but the concept is the same). Unlike classic divergence, which compares price to an oscillator like RSI or MACD on a single chart, SMT compares the market structure of two correlated assets on the same timeframe. No indicator is required to spot it. When two markets that normally move together stop agreeing at an important high or low, that non-confirmation is interpreted as a sign that one market is 'faking' the move while the other reveals the truer direction. The logic is tied to liquidity: often one asset runs stops by taking out a prior high or low while its partner refuses to follow, hinting that the move may be a fakeout rather than a genuine continuation.
Bullish vs. bearish SMT
The two variants are defined precisely by how the swing points compare. A bearish SMT prints when one asset makes a higher high while the correlated asset makes a lower high, signaling weakness in an uptrend. A bullish SMT prints when one asset makes a lower low while its partner makes a higher low, signaling weakness in a downtrend. The key is that the divergence must occur at a meaningful swing point, not at every minor wiggle, and ideally where one market has just swept obvious liquidity (a prior session high or low).
Which correlated pairs traders watch
SMT only makes sense between instruments that are genuinely positively correlated. Commonly watched pairs by asset class include:
- Index futures: ES vs. NQ (and YM); internationally, DAX vs. FTSE
- Forex: EUR/USD vs. GBP/USD, or USD/JPY vs. USD/CHF (DXY is watched inversely)
- Crypto: BTC vs. ETH
- Metals: Gold (XAU) vs. Silver (XAG)
- Bonds: ZN vs. ZB; Energy: WTI vs. Brent crude
Correlation strength and stability matter enormously. A historically tight relationship can weaken, decouple, or even invert under a new market regime, which invalidates the read. Loosely correlated assets produce constant, meaningless 'divergences' that are simply noise.
How traders read and confirm it
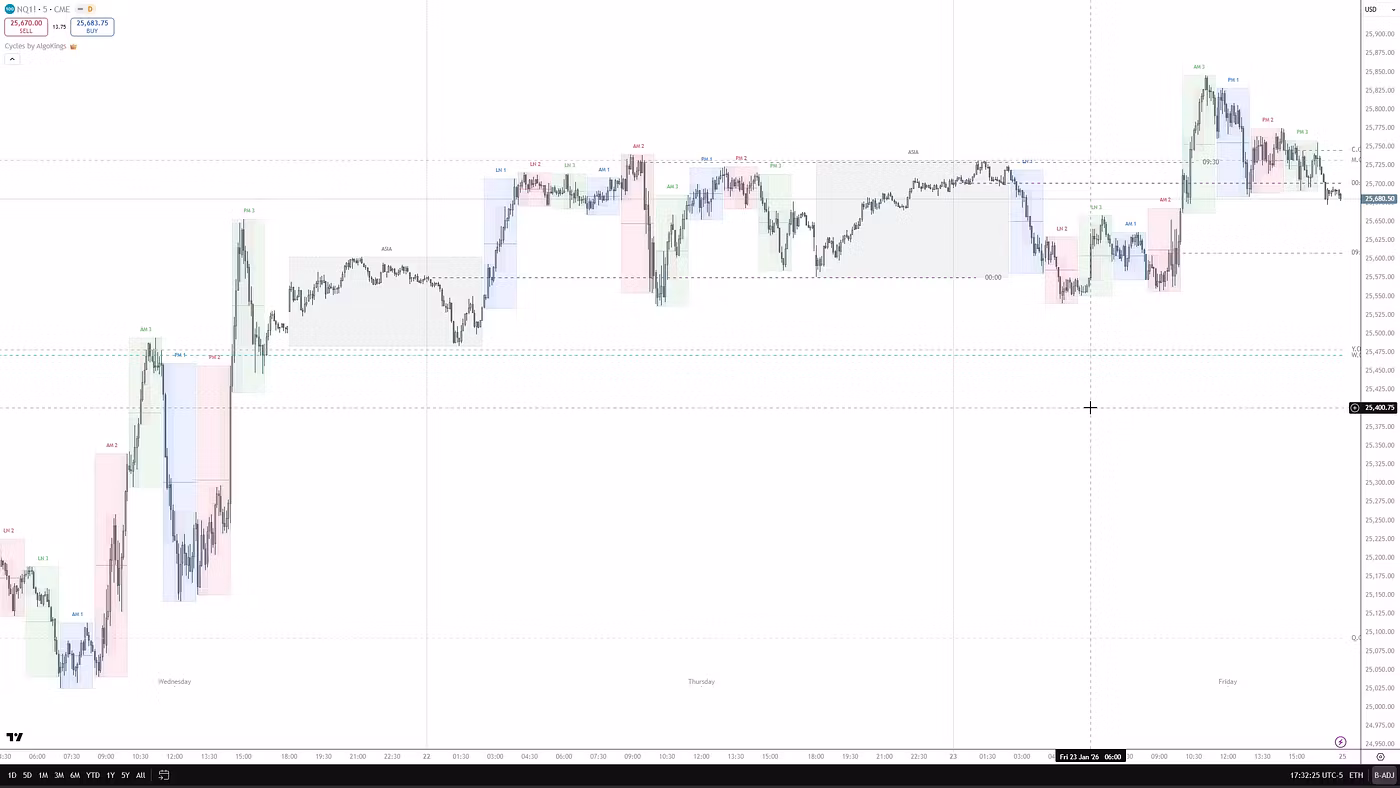
The practical workflow is to pull both charts side by side on the same timeframe with aligned candles, mark the relevant swing points, and compare. SMT is typically used as confirmation at a higher-timeframe level (a PD array, order block, or fair value gap) rather than in isolation. Most who use it wait for a market-structure shift (MSS) or change in state of delivery (CISD) before acting, place protective stops beyond the swept high or low, and reference the opposite liquidity pool as a logical objective. Intraday execution often happens on 15-minute or lower charts, while higher timeframes produce fewer but stronger signals; aligning with a daily directional bias adds context. This is analysis and timing, not a trade recommendation — outcomes are never guaranteed, and position sizing and risk control remain your responsibility.
Common pitfalls and limitations
- Treating SMT as an automatic, standalone reversal signal — it is a confirmation tool, and strong momentum can keep a market trending despite a divergence
- Using assets that are not genuinely correlated, or forgetting that correlations can shift, decouple, or invert over time
- Hunting for SMT at every minor swing instead of at significant session or higher-timeframe levels
- Confusing SMT with classic RSI/MACD divergence — they use entirely different inputs
- Comparing mismatched timeframes or non-aligned candles, which fabricates divergences that aren't real
- Trusting non-confirmations during low-liquidity dead zones, where quote gaps create artificial disagreement
- Skipping confirmation (a structure shift or displacement) and entering on the divergence alone
SMT divergence is not a holy grail. It is one piece of confluence within a broader, risk-aware framework — most useful when it appears at a meaningful level, in correlated markets, alongside other evidence.
Frequently asked questions
How is SMT divergence different from regular RSI or MACD divergence?
Classic divergence compares price to an oscillator (RSI, MACD) on a single chart. SMT divergence compares the actual price structure of two correlated assets on the same timeframe and needs no indicator — you are looking for one market to make a new high or low that its partner fails to confirm.
What is the difference between bullish and bearish SMT?
A bullish SMT forms when one asset makes a lower low while its correlated partner makes a higher low (downtrend weakness). A bearish SMT forms when one asset makes a higher high while its partner makes a lower high (uptrend weakness).
Do I need a special indicator to spot SMT divergence?
No — it can be read manually by placing two correlated charts side by side on the same timeframe and comparing their swing points. An indicator simply automates detection and can make non-confirmations faster to see, but the underlying concept is pure price action.
Risk disclosure
AlgoKings provides technical analysis indicators and educational material for informational purposes only. Nothing on this website is financial, investment or trading advice. Trading financial instruments carries a high level of risk and may not be suitable for every investor; you can lose some or all of your capital. Indicators do not predict future price movements and do not guarantee any outcome. You are solely responsible for your own trading decisions and risk management. Past performance is not indicative of future results.