Optimal Trade Entry (OTE) Explained
Optimal Trade Entry (OTE) is a Fibonacci-based, trend-continuation entry technique from the ICT / Smart Money methodology that identifies the 0.62-0.79 retracement zone as the highest-probability place to enter after a strong impulsive move. It is a location for an entry, not a buy/sell signal, and price does not always retrace deep enough to reach it.
What Optimal Trade Entry actually means
OTE comes from the Inner Circle Trader (ICT) / Smart Money Concepts framework. The core logic is a three-part sequence: a strong impulsive move (displacement), a retracement against it, and then a continuation in the original direction. Rather than chasing price at the extreme, OTE waits for the pullback and looks to enter deep into it. This is a trend-continuation tool, not a reversal tool, and it is meant to improve your reward-to-risk by entering at a better location, not to predict that price must turn.
ICT frames any price range as premium (the upper half, relatively expensive), discount (the lower half, relatively cheap), and equilibrium (the 0.5 midpoint). In an uptrend you want to buy in discount; in a downtrend you want to sell in premium. The OTE zone always sits in that favorable half.
The Fibonacci levels and why 0.705 isn't on your tool
Draw the Fibonacci from the wick extremes of the displacement leg: swing low to swing high in an uptrend, swing high to swing low in a downtrend. The OTE zone is the retracement band between 0.62 and 0.79 (the 0.79 boundary is the classic 78.6% level, rounded), with 0.705 (70.5%) treated as the 'sweet spot' midpoint, 0.5 as equilibrium, and negative extensions (such as -0.27 and -0.62) used as profit targets beyond the prior swing. The 0.705 level is not a TradingView default, so you must open the Fib retracement tool's settings, manually add 0.705 (and your extensions), and save it as a template so it loads every time.
Entry, stop, and target placement
Two common execution styles exist. A resting limit order inside the 0.62-0.79 zone fills automatically but risks being run through. Waiting for confirmation, such as a rejection candle or a lower-timeframe market-structure shift inside the zone, trades some fill probability for evidence that price is actually reacting. Stops typically sit just beyond the move's origin (the 1.0 level / swing extreme), and targets are placed at the prior high or low, opposing liquidity, or the negative Fibonacci extensions. Framed this way, OTE is fundamentally a reward-to-risk tool. None of this guarantees a fill or a reaction, so position sizing and a predefined invalidation matter more than the level itself.
Confluence: where the edge comes from
- Higher-timeframe directional bias the setup agrees with (an OTE against the dominant trend fails far more often)
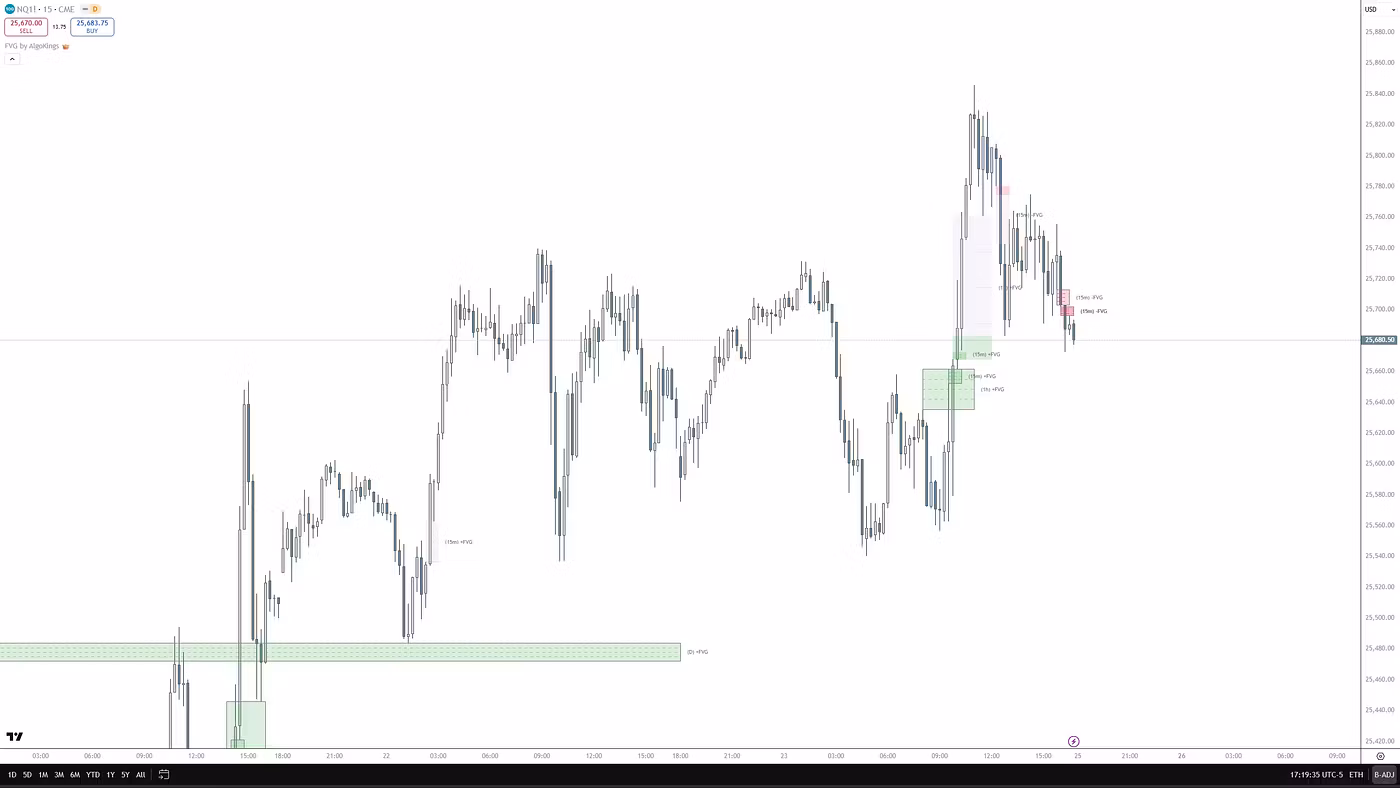
- A fair value gap (FVG) overlapping the OTE zone
- An order block or breaker block sitting inside the zone
- A liquidity sweep just before the retracement completes
- ICT killzones / time windows aligning with the entry
Used in isolation, OTE is just a Fibonacci zone. Its practical edge comes from stacking these factors so that several independent reasons point to the same price.
Timeframes, markets, and realistic expectations
OTE is timeframe-agnostic: scalpers find it on 1-5 minute charts, day traders on 15m-1h, and swing traders on 4h-daily, and it applies across forex, indices, crypto, and commodities because it is built on price structure rather than any single instrument. But it is discretionary and not academically validated, so backtest it on your own market and timeframe. Price frequently wicks past 0.705 or through the whole zone before reacting, and it often doesn't retrace deep enough to trigger anything at all, so OTE produces selective, not constant, opportunities. Treat it as one component of a risk-managed plan.
Frequently asked questions
Why 0.705, and how do I add it to TradingView?
0.705 (70.5%) is the midpoint of the ICT OTE zone (0.62-0.79) and is treated as the deepest 'sweet spot' retracement before continuation. It isn't a default Fibonacci level, so open the Fib retracement tool's settings, add a custom 0.705 level (plus any negative extensions you target), and save it as a template so it loads on every chart.
Is OTE a buy or sell signal?
No. OTE is a location, a high-probability zone where you might look for an entry that aligns with your higher-timeframe bias and other confluence. It is an analytical and educational framework, not a signal, and it does not tell you to buy or sell or guarantee that price will reverse there.
How is OTE different from a normal Fibonacci retracement?
A standard retracement watches single levels like 61.8% or 78.6% as potential support or resistance. OTE defines a deeper continuation zone (0.62-0.79 with 0.705 as the focus) and is specifically combined with ICT context, displacement, premium/discount, FVGs, order blocks, and defined stops and targets, rather than used as a level on its own.
Risk disclosure
AlgoKings provides technical analysis indicators and educational material for informational purposes only. Nothing on this website is financial, investment or trading advice. Trading financial instruments carries a high level of risk and may not be suitable for every investor; you can lose some or all of your capital. Indicators do not predict future price movements and do not guarantee any outcome. You are solely responsible for your own trading decisions and risk management. Past performance is not indicative of future results.