Best TradingView Indicators for Gold (XAUUSD): An Honest Buyer's Guide
There is no single "best" TradingView indicator for gold (XAUUSD) — anyone selling you one is overselling. The realistic answer is a small toolkit: a volatility tool like ATR to size stops, plus structure and liquidity tools (order blocks, fair value gaps, break of structure, session/killzone overlays) that map gold's deep stop-hunt wicks and session-driven range. A good gold trading indicator on TradingView measures past behaviour or current conditions; it does not forecast. This guide explains why these categories fit gold specifically, what each does, and the mistakes that cost XAUUSD traders money.
Educational content only — not financial advice. No indicator predicts price. Every tool described here measures past behaviour or current conditions and frames probabilities; none tells you what gold will do next.
First, the honest framing: indicators combine, they don't compete
Hunting for the one magic indicator for XAUUSD is the wrong question. Robust analysis layers four categories, each answering a different question about the chart. Diversify by category, not by quantity — five momentum oscillators all saying the same thing is not confluence, it's noise.
- Trend (e.g. moving averages): is gold trending or ranging right now?
- Momentum (e.g. RSI, MACD): is the current move strengthening or fading?
- Volatility (e.g. ATR): is the range expanding or contracting?
- Structure & liquidity (SMC/ICT tools): where are the key zones, and where is resting liquidity (stops) likely to be?
The structure-and-liquidity layer is the category AlgoKings builds for. The case for prioritising it on gold is not that it's magic — it's that gold's behaviour makes that context unusually useful. Here's why.
Why gold's behaviour suits structure & liquidity tools
Gold is far more volatile than FX majors
A typical XAUUSD day moves several times the range of EURUSD in money terms. The practical takeaway: fixed point distances and tight stops calibrated to a calm FX pair get wicked out on gold. Volatility-aware and structure-aware tools fit this instrument better than rigid mechanical levels. (A quick unit note, because gold quoting trips people up: brokers differ. Many treat one pip as a $0.10 move — so 2400.00 to 2401.00 is 10 pips — while others quote the same $1 move as 100 points or cents. Check your platform's convention before copying any pip figure, including the ones in this guide.)
Gold is a sentiment and fear gauge
Gold reacts sharply to macro forces: real yields on the 10-year, the US dollar (DXY), FOMC decisions, CPI, and risk-off geopolitical flows. A stronger dollar and rising real yields are widely cited among the biggest headwinds for gold. The cleanest chart level can be ignored entirely on a headline, which is exactly why no indicator should be trusted in isolation.
Gold is notorious for stop hunts and deep wicks
Gold routinely spikes past an obvious high or low — sweeping the stop-losses clustered there — before reversing. Liquidity-sweep and structure tools exist specifically to map where that resting liquidity sits. The very behaviour that punishes naive breakout and tight-stop traders is what these tools try to put in context. That is the honest reason they're popular for XAUUSD — a fit argument, not a guaranteed-edge argument.
Gold respects session rhythm
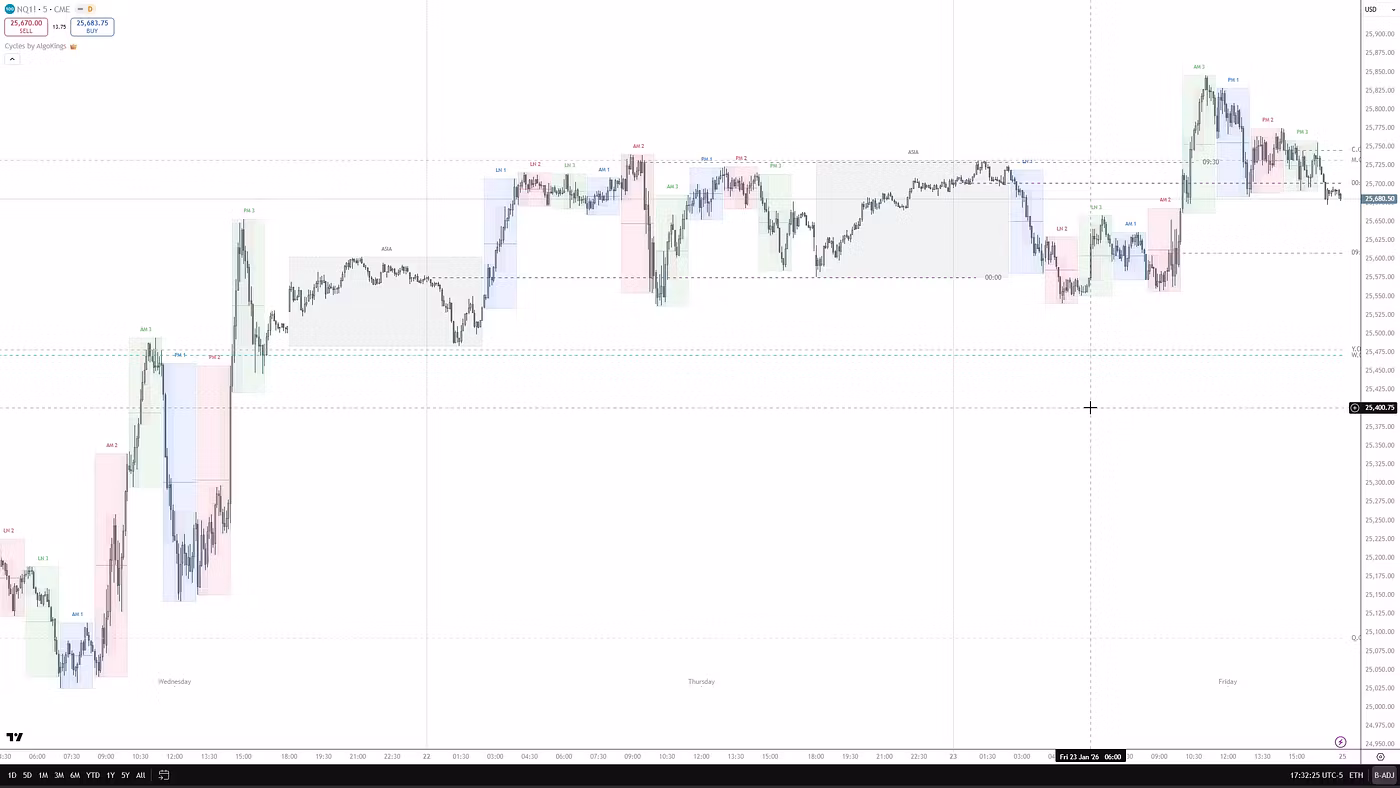
Much of gold's daily range is set around the London open and during the London–New York overlap, while the thinner Asian session often forms a consolidation range that later sessions target. Session/killzone overlays put these windows on your chart so you can favour high-participation hours over low-quality Asian chop — a concrete, defensible benefit, not hype.
The structure & liquidity vocabulary (what these tools actually plot)
- Order Block (OB): the last opposing candle before a strong move — treated as a zone price may react to again.
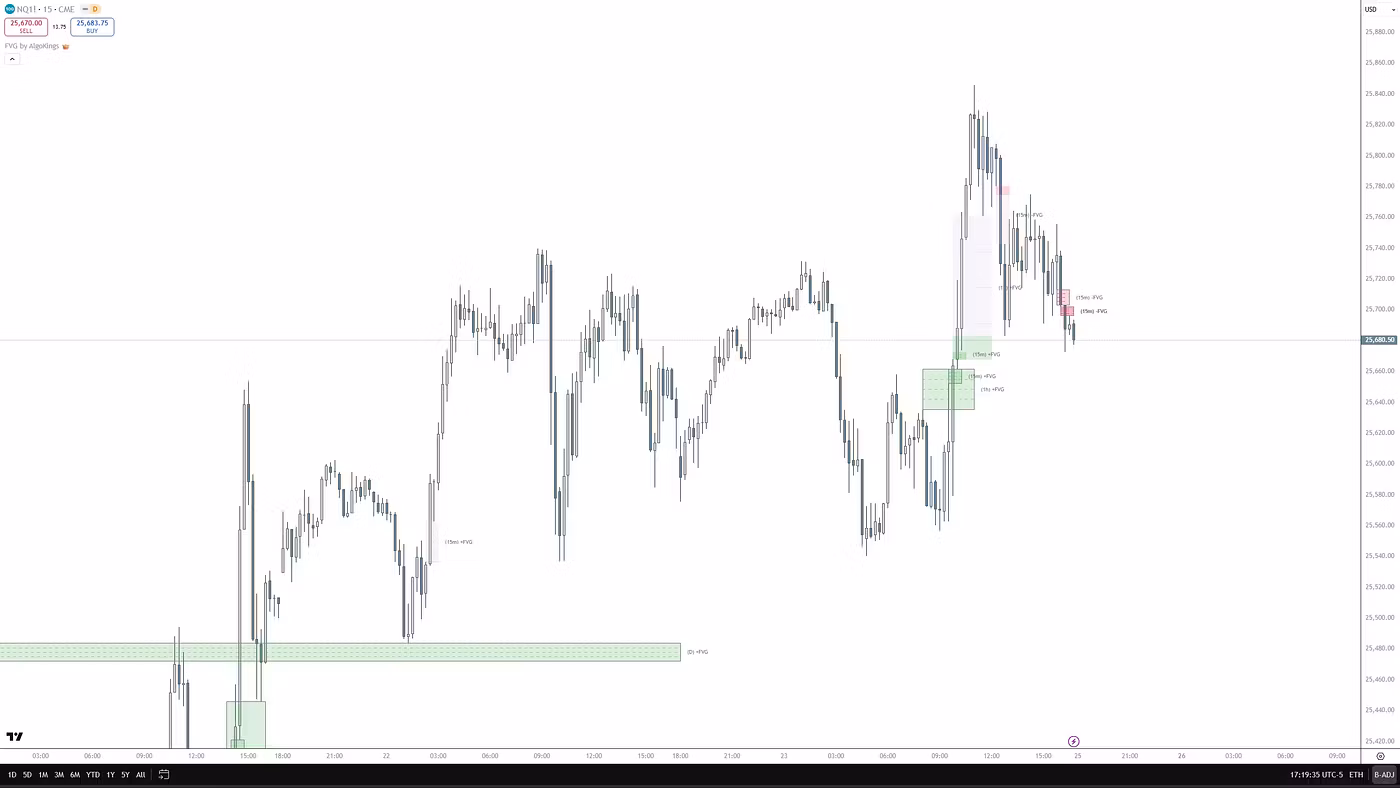
- Fair Value Gap (FVG) / imbalance: a three-candle gap left by a fast move; price often (not always) returns to fill it.
- Break of Structure (BOS): price breaks a prior swing in the trend direction — read as a continuation signal.
- Change of Character (CHoCH): price breaks structure against the prior trend — read as a potential reversal signal.
- Liquidity sweep: a spike through an obvious high or low that triggers clustered stops, often followed by a reversal.
- Killzones: defined high-activity session windows (e.g. London open, London–NY overlap).
- Power of Three (PO3 / AMD): the idea that a session cycles through accumulation, manipulation (a false sweep), and distribution (the real move), used to frame a directional bias.
State this plainly: SMC/ICT is a discretionary framework, not an academically validated system. 'Smart money,' 'institutional orders,' and 'manipulation' are interpretive labels for observed price behaviour — not verified order-flow data. An indicator that plots an order block automates the drawing; it does not confirm any institution actually transacted there. Treat these as decision-support overlays, and beware confirmation bias: after the fact, almost any reversal can be relabelled a 'liquidity grab.'
The one indicator most worth having on gold: ATR
If you want a single gold-specific tool, ATR (Average True Range) is the most-cited choice — not because it predicts direction (it doesn't), but because it sizes stops and targets to current volatility instead of a fixed number. A common heuristic uses a 14-period ATR and treats gold as being in a more active, trend-friendly regime when ATR sits above its own recent average (roughly a 20-period look). Pairing ATR-based stops with a macro check (DXY and real yields) covers the two things structure tools deliberately don't: how big the moves are right now, and what's driving them.
Sessions and timeframes that matter for XAUUSD
- Asian session (~22:00–06:00 GMT): thinner, choppier, wider spreads; forms the overnight range. Many intraday gold traders avoid it.
- London open / killzone (~07:00–10:00 GMT): often establishes the bulk of the daily range; also where an early false move (the 'Judas swing') is said to trap traders.
- London–NY overlap (~12:00/13:00–16:00 GMT): typically the highest liquidity; US data (CPI, FOMC, NFP) lands in the NY morning and drives continuation or reversal.
- Timeframes: Daily and 4H for swing bias; 15/5/3-minute for entries. Many gold traders act only on closes (e.g. 1H or 4H) beyond a level to filter constant false breakouts.
Times drift with daylight saving and broker server time, so fixed killzone hours shift seasonally — verify the windows against your own clock rather than trusting a hard-coded number.
Where AlgoKings fits — and where it doesn't
AlgoKings builds TradingView indicators in the structure-and-liquidity category: order blocks, FVGs, BOS/CHoCH, liquidity zones, session/killzone overlays, and PO3/bias aids. On gold they earn their place by automating the chart-marking that gold's stop-hunt wicks and session-driven range demand, and by applying one consistent framework instead of you eyeballing zones differently every session. The SMC Package and standalone tools like FVG cover the structure layer; the Goldbach (GB) range adds number- and level-based context for traders who already use that method.
Be clear about the limits. These are decision-support overlays, not signal generators, and they make no profit or win-rate promises. They don't manage risk, don't size positions, and can't price in a surprise FOMC. Treat AlgoKings as one component — the structure layer — alongside your own trend and momentum reads, an ATR-based volatility check, a macro glance at DXY and yields, and your own tested rules. A good indicator removes guesswork from drawing; it never removes the need to think.
Common mistakes that cost gold traders money
- Applying FX risk rules to gold: the same lot size as EURUSD can oversize your risk because gold's moves are larger. A common adjustment is reducing lot size relative to an FX major while keeping risk to a fixed share of the account per trade.
- Tight, exact stops: placing a stop right on the obvious high or low is placing it where the sweep happens. Many traders add a buffer beyond the swing instead.
- Trading the Asian session like London: thinner liquidity, wider spreads, and choppy 'setups' that are mostly noise.
- Trusting clean patterns through major news: CPI, FOMC, and geopolitics can override technicals, and gold can move sharply in minutes.
- Treating SMC/ICT labels as fact: they're interpretive. Backtest and forward-test your own rules instead of trusting hindsight stories.
- Repainting and over-fitting: some structure indicators redraw zones as new candles form. Verify on bar replay and forward data before believing a level 'always works.'
- Indicator soup: stacking many tools from the same category. Confluence means different categories agreeing, not the same signal five times.
Frequently asked questions
What is the best indicator for XAUUSD on TradingView?
There isn't a single best one, and that's the honest answer. Combine four categories: trend (e.g. moving averages), momentum (e.g. RSI/MACD), volatility (ATR), and structure/liquidity (order blocks, FVGs, killzones). If you want the most gold-specific single tool, ATR is a strong pick — because it sizes stops to gold's volatility rather than predicting direction.
Why does gold keep hitting my stop loss and then reversing?
That's often a liquidity sweep. Stops cluster just above obvious highs and below obvious lows, and gold routinely spikes through those levels to trigger them before reversing. Common responses: place structure-based stops with a buffer beyond the swing rather than exactly on it, and size the position so a wider stop still keeps risk within your fixed per-trade limit.
What are the best times to trade gold?
The London open (~07:00–10:00 GMT) and the London–New York overlap (~12:00/13:00–16:00 GMT) usually carry the most liquidity and tend to set the daily range. The Asian session is thinner, choppier, and has wider spreads, so many intraday traders avoid it. Note that these windows shift with daylight saving and broker server time.
Do Smart Money Concepts (SMC/ICT) actually work on gold?
SMC/ICT is a discretionary framework, not an academically proven system. It maps onto gold's behaviour well — deep stop-hunt wicks and clear session structure are exactly what its liquidity and killzone concepts describe. But terms like 'smart money' and 'manipulation' are interpretive labels, not verified order flow. Results depend on your own rules, testing, and discipline, not on the labels themselves.
What lot size should I use and how much should I risk on gold?
This is general information, not advice. A widely taught convention is risking a small, fixed share of the account per trade. Because gold is more volatile than FX majors, traders often reduce lot size relative to a pair like EURUSD and then use ATR so that stop distance and position size reflect current volatility. Test any approach on your own account and risk tolerance first.
Are AlgoKings indicators signals that tell me when to buy or sell?
No. AlgoKings tools are structure-and-liquidity overlays — they automate drawing order blocks, FVGs, BOS/CHoCH, liquidity zones, and session windows. They're decision-support, not signal generators, and they make no profit or win-rate promises. You still supply the bias, risk management, macro check (DXY and yields), and tested rules; the indicator just removes the manual chart-marking.
Risk disclosure
AlgoKings provides technical analysis indicators and educational material for informational purposes only. Nothing on this website is financial, investment or trading advice. Trading financial instruments carries a high level of risk and may not be suitable for every investor; you can lose some or all of your capital. Indicators do not predict future price movements and do not guarantee any outcome. You are solely responsible for your own trading decisions and risk management. Past performance is not indicative of future results.