The Best Liquidity Indicator for TradingView
There is no single objectively "best" liquidity indicator for TradingView, but the most useful ones automatically map where resting orders cluster — buyside liquidity above prior highs and sellside liquidity below prior lows — and flag when price sweeps those levels. The right choice depends on your market, timeframe, and style, and works best alongside market structure and volume confirmation rather than in isolation.
What a "liquidity indicator" actually shows
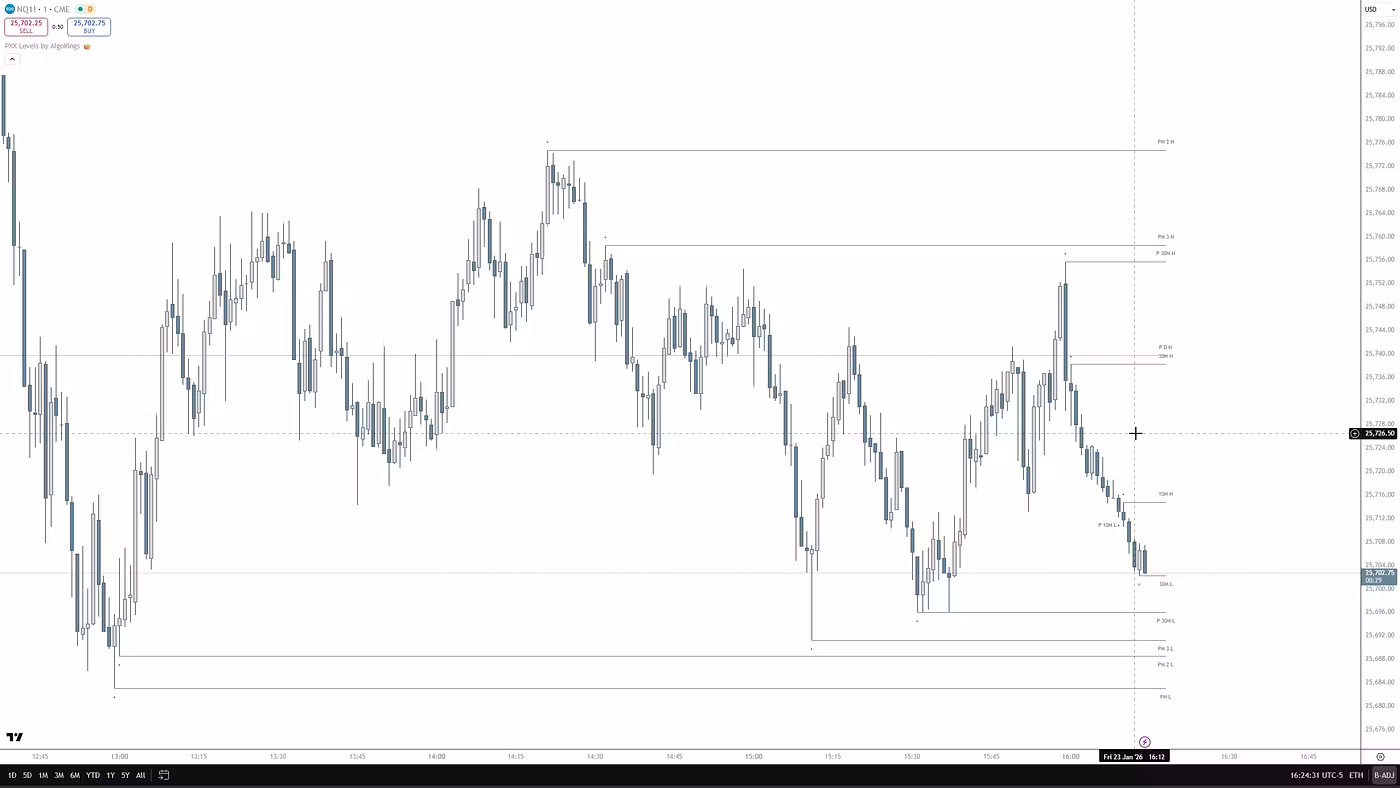
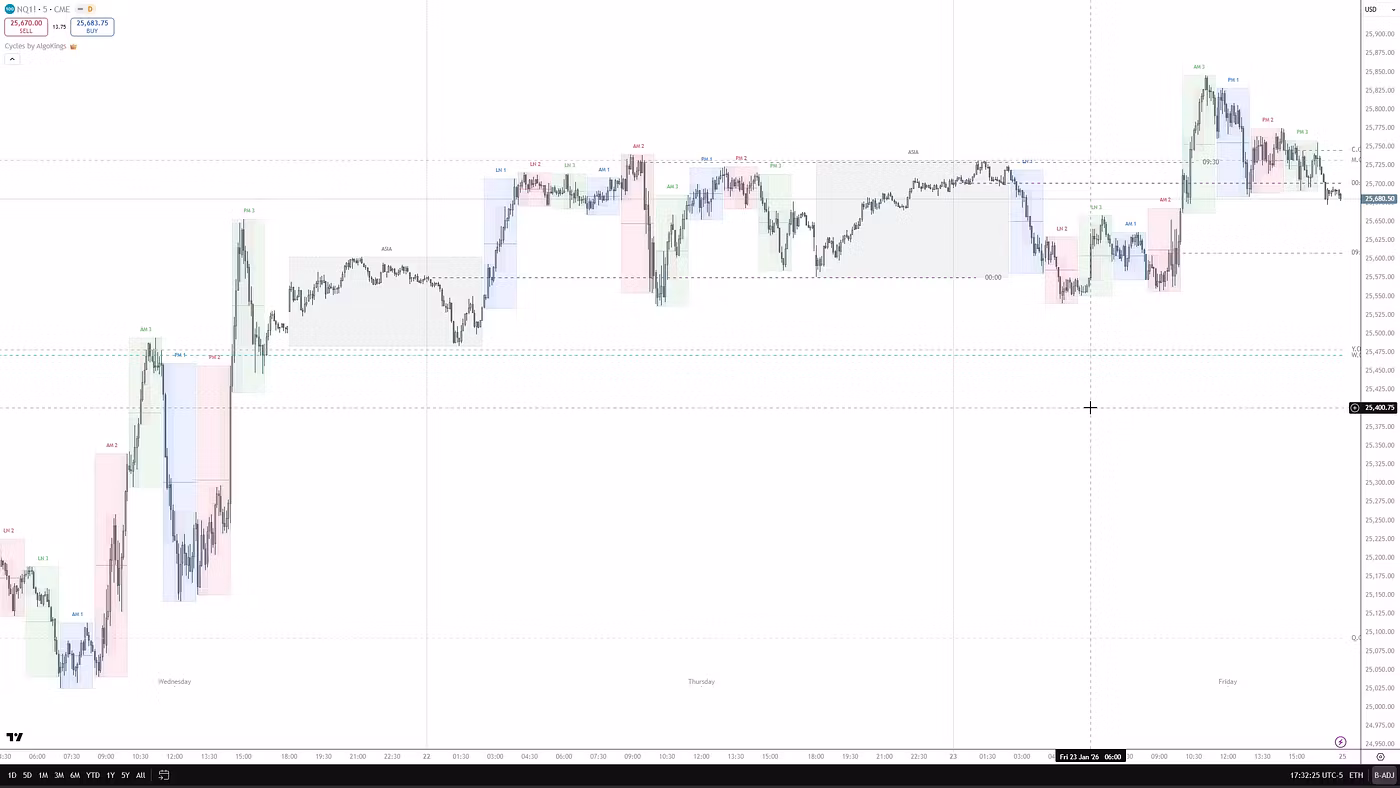
In the Smart Money Concepts (SMC) and ICT context, a liquidity indicator visualizes where pending orders and stop-losses are likely to cluster on the chart. These pools form predominantly above prior swing highs and below prior swing lows, at equal highs/lows (double tops and bottoms), at prior-day and session extremes, and around order blocks. The tool auto-detects these zones, draws them, and often removes or marks them once price has traded through. The premise behind the framework is that large participants tend to drive price toward these pools to fill sizeable orders with less slippage, frequently before a reversal.
This is the single most common point of confusion: order-cluster "liquidity" (stops and pending breakout orders) is not the same as classic market liquidity (volume, bid-ask spread, and depth-of-market). They are related — volume is often used as confirmation — but a liquidity indicator highlights where orders likely rest, not how easily a contract can currently be bought or sold. Treat it as a map of probable order locations, not a measure of tradability.
Buyside vs sellside liquidity, and sweeps
- Buyside liquidity (BSL): buy stops and breakout orders resting above prior highs and equal highs. Price reaching up into this zone can trigger those orders.
- Sellside liquidity (SSL): sell stops and breakdown orders resting below prior lows and equal lows. A move down into this zone can trigger those orders.
- Liquidity sweep / grab / raid: a sharp push beyond a level that quickly reverses, suggesting the resting orders were taken. The terms differ mainly in scale — a brief "grab" of a single level versus a deeper "run" through several pools — but all describe price taking liquidity and rejecting.
- The key distinction from a normal breakout: a genuine breakout tends to hold beyond the level and continue, while a sweep spikes through and fails. Price that holds and extends is simply a breakout, not a sweep.
How to read and use one, step by step
A liquidity indicator does not predict direction on its own — it shows where orders likely sit. The signal only becomes actionable once price confirms. A typical SMC workflow is: (1) identify the relevant buyside or sellside zone; (2) wait for price to sweep it; (3) look for rejection and a market structure shift such as a break of structure (BOS) or change of character (CHoCH); (4) wait for a return into a nearby order block or fair value gap; and (5) only then consider a setup, with a stop beyond the swept level. Confirm on closed candles — some pivot- and sweep-based scripts only finalize a zone after the candle closes, so live signals can shift. Volume behaviour helps too: a real move tends to sustain volume, while a liquidity grab often spikes then fades.
Types of liquidity indicators and how to choose
- Buyside/sellside zone mappers that auto-draw BSL and SSL levels from swing points and equal highs/lows.
- Liquidity sweep detectors that specifically flag the spike-and-reject behaviour beyond a level.
- Liquidity pool / clustering tools that group nearby levels into broader zones.
- Liquidity void / imbalance and fair value gap tools that surface unfilled price gaps where price moved quickly in one direction.
- Volume-profile approaches (high- and low-volume nodes) that approach liquidity from the volume side rather than the order-cluster side.
There is no universal "best" because the right tool depends on your market (forex, gold/XAUUSD, indices, crypto), your timeframe, and whether you trade intraday or higher-timeframe swings. The strongest setups come from confluence — a liquidity tool plus market structure, multi-timeframe context, and volume — not from any single script. Free TradingView indicators can teach the concepts well; paid tools typically add cleaner auto-detection, more zone types, and configurability. Either way, avoid stacking many overlapping scripts, which produces conflicting signals and analysis paralysis.
Risk and honest expectations
Liquidity sweeps are high-volatility events by definition, so stops placed tightly just beyond an obvious level are exactly what tends to get hunted — size and place stops with that in mind. SMC is a discretionary framework, not a mechanical win rate, and it is easy to over-fit zones to past price. No indicator removes the need for your own confirmation, backtesting, and risk management, and none guarantees an outcome. Use these tools to structure your analysis, not to outsource your decisions.
Frequently asked questions
Is a liquidity indicator the same as volume?
No. A liquidity indicator highlights where resting orders and stop-losses likely cluster (above highs, below lows, at equal highs/lows). Classic market liquidity — volume, bid-ask spread, depth-of-market — measures how easily an asset trades. They are related and volume is often used for confirmation, but they are not the same thing.
How do I trade a liquidity sweep, and where does the stop go?
The framework's approach is to wait for price to sweep a zone and then reject, ideally with a market structure shift (BOS/CHoCH) and a return into an order block or fair value gap, before considering a setup. Stops are typically placed beyond the swept level. Confirm on closed candles and remember a sweep that keeps going is just a real breakout — this is analysis, not a buy/sell signal.
Do liquidity indicators repaint?
Some pivot- and sweep-based indicators only confirm a zone after the candle closes, so live, intrabar signals can shift before settling. Always evaluate on closed candles, check the indicator's documentation for its lookback behaviour, and backtest before relying on it.
Risk disclosure
AlgoKings provides technical analysis indicators and educational material for informational purposes only. Nothing on this website is financial, investment or trading advice. Trading financial instruments carries a high level of risk and may not be suitable for every investor; you can lose some or all of your capital. Indicators do not predict future price movements and do not guarantee any outcome. You are solely responsible for your own trading decisions and risk management. Past performance is not indicative of future results.