Supply and Demand Zones Explained
Supply and demand zones are chart areas — not single lines — where price previously made a sharp, one-directional move, marking a region of likely unfilled buying or selling interest. In supply and demand trading, a demand zone sits below price where a rally began, and a supply zone sits above price where a sell-off began.
Supply and demand trading is a price-action approach built around imbalance: a zone matters precisely because price left it fast. That speed implies one side was far more aggressive than the other. Rather than drawing a single horizontal line, you mark the whole area a move originated from and treat it as a region price may react to if it returns.
Demand zones and supply zones
What a demand zone is
A demand zone is a price area below current price where price previously stopped falling and rallied sharply. It is read as a region where buying interest overwhelmed selling, and it behaves like a zone-based support area — somewhere buyers may step in again if price revisits it.
What a supply zone is
A supply zone is a price area above current price where price previously stopped rising and dropped sharply. It is read as a region where selling overwhelmed buying, and it acts like zone-based resistance — somewhere sellers may reappear on a retest.
How a zone forms: base, departure, return
This framework — often attributed to trading educator Sam Seiden — describes three stages. Most quality criteria come down to how clean these three stages look.
- Base — a brief pause or consolidation with small candles and low volatility (rough balance between both sides).
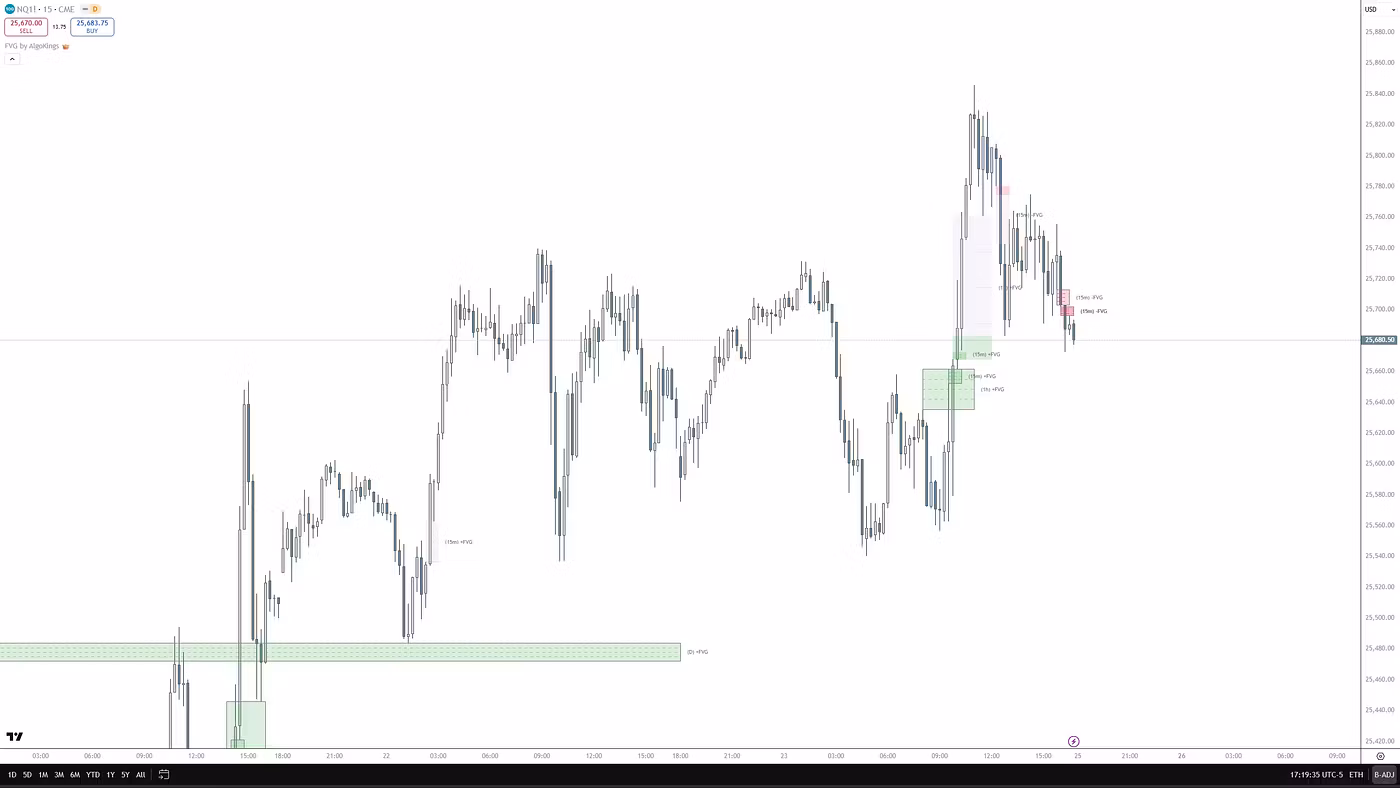
- Departure (leg-out) — price leaves the base with large, strong candles, often breaking structure and leaving a fair value gap. The strength of this leg is the single most important quality signal.
- Return / retest — price later retraces toward the base; this is where traders look for an entry.
The four classic patterns
Practitioners name four base patterns. Reversal patterns (a turn in direction) are commonly taught as stronger than continuation patterns (a pause within a trend) — though that is a teaching convention, not a proven rule.
- Rally-Base-Drop (RBD) → forms a supply zone (up, pause, sharp down) — reversal.
- Drop-Base-Rally (DBR) → forms a demand zone (down, pause, sharp up) — reversal.
- Rally-Base-Rally (RBR) → a demand zone within an uptrend — continuation.
- Drop-Base-Drop (DBD) → a supply zone within a downtrend — continuation.
How to draw a zone: proximal and distal lines
Two boundaries define a zone. The proximal line is the edge nearest current price — where you watch for a reaction. The distal line is the far edge, where a stop-loss often sits just beyond. In a demand zone the proximal line is the top of the base and the distal is the bottom; in a supply zone it is reversed.
Common quality criteria traders cite: an explosive leg-out, a tight base (a rough rule of thumb is roughly six candles or fewer), a clear imbalance or fair value gap inside the move, and alignment with the higher-timeframe trend. A fresh, untested zone is generally considered higher-probability than one price has already tapped several times — each retest is thought to consume the resting interest, and once price closes decisively through a zone it is usually treated as invalid.
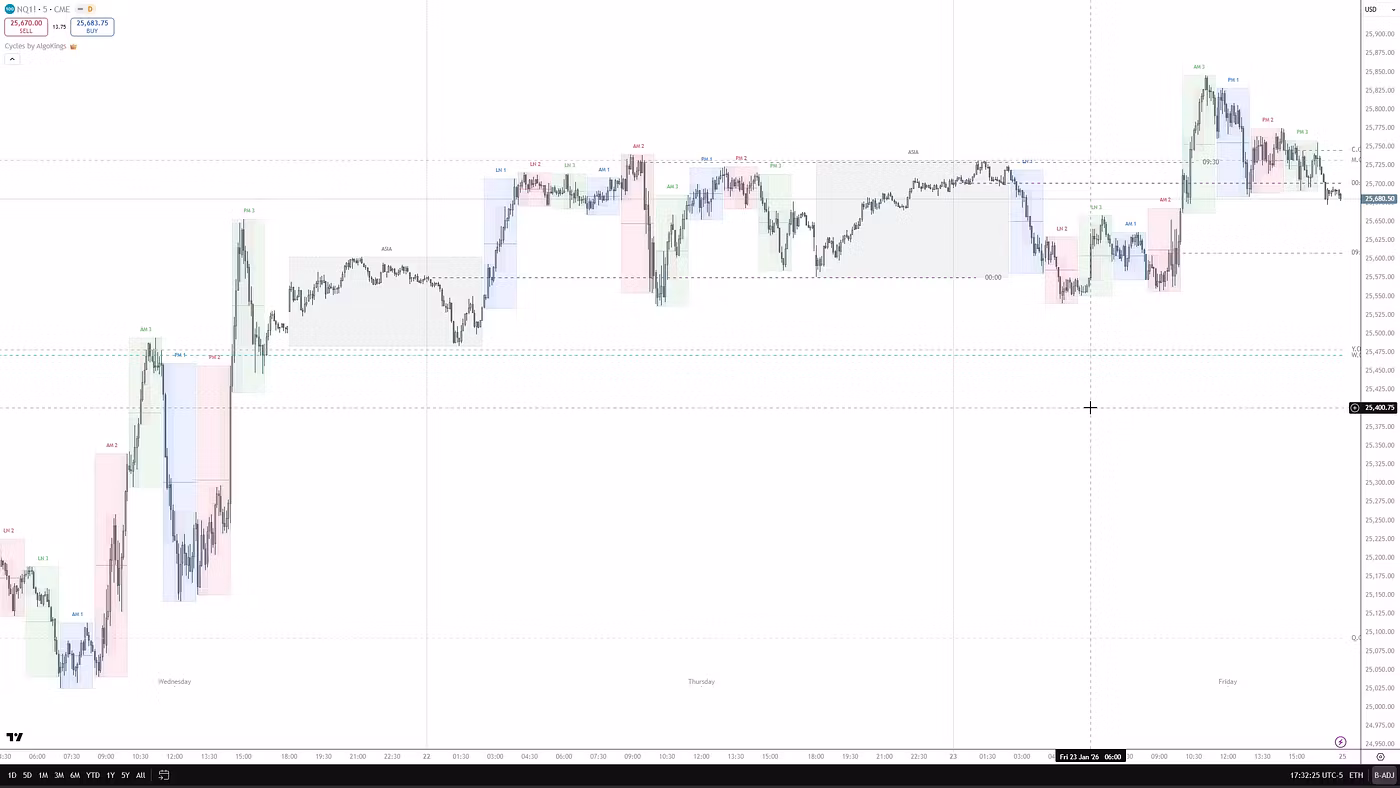
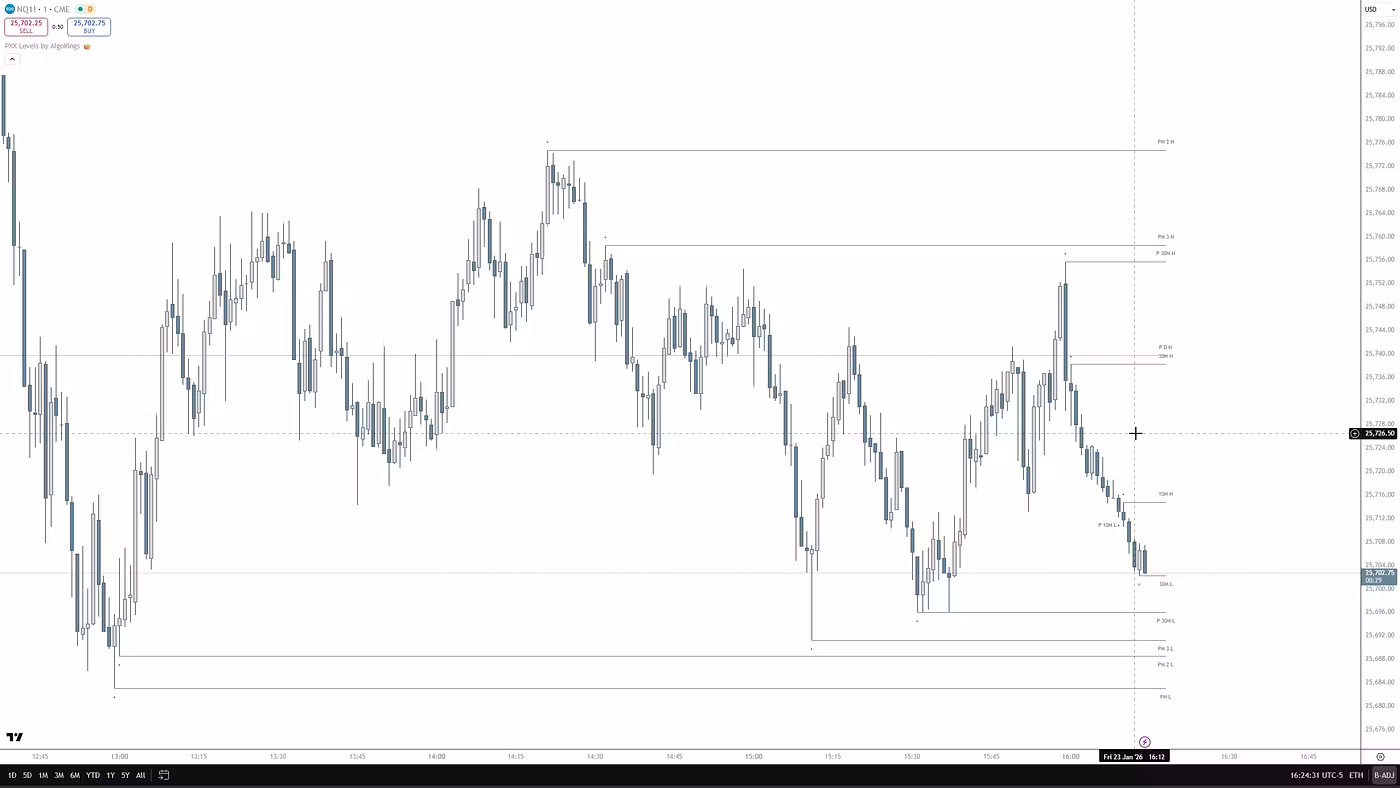
Multi-timeframe work is standard: map major zones on the daily or weekly chart, then refine entries on a lower timeframe such as the 1H or 15m.
Supply and demand zones vs order blocks (SMC / ICT)
This is the distinction most newcomers get wrong. A supply or demand zone is the broader area — the base plus the surrounding candles — that the move originated from. An order block in ICT/SMC is a refined subset: typically the last opposing candle (or small cluster) right before the displacement that broke structure. If the zone is the map, the order block is the pin inside it.
Many traders use the two together — draw the wider zone first, then locate the order block candle inside it to time the entry, often where it overlaps an unmitigated fair value gap. These are best treated as related lenses on the same underlying idea (imbalance plus where a move began), not competing truths.
Common mistakes
- Drawing zones too wide — it wrecks entry precision, stop placement and risk:reward.
- Tracking too many zones — every chart has dozens; selectivity beats clutter.
- Fading the higher-timeframe trend — buying a demand zone inside a strong downtrend (or vice versa) is a classic way to get stopped out.
- Assuming an automatic bounce — entering with no confirmation, as if the zone guarantees a reversal.
- Treating zones as permanent — ignoring that retests weaken a zone and a close through it invalidates it.
- Trading zones in a choppy range — in low-volatility, directionless conditions price often slices straight through.
- Leaning entirely on an auto-detection script — automated tools should support judgement and context, not replace them.
An honest look: what zones can and cannot do
Zones are a probability tool, not a guarantee — price frequently passes straight through. Identification is also subjective: two traders will draw different zones on the same chart depending on where they think the base starts and whether they include wicks. The popular 'unfilled institutional orders sitting in the zone' rationale is an explanatory narrative, not a verified mechanism — you cannot actually see who transacted, and large players often hide size in dark pools or iceberg orders. Hindsight bias makes zones look obvious after the fact, while spotting tradeable ones in real time is far harder. There is no robust public evidence that supply and demand zones produce reliable profits on their own; any edge comes from the whole process — trend context, confirmation and, above all, risk management and position sizing.
Frequently asked questions
What is the difference between supply and demand zones and support and resistance?
Supply and demand zones are areas tied to where a strong move originated (an imbalance), so they are ranges. Support and resistance are usually single horizontal lines drawn from repeated historical reactions. They overlap heavily, but zones emphasise the speed of the departure rather than the number of touches.
What is the difference between a supply/demand zone and an order block?
A supply or demand zone is the broader base-plus-surrounding-candles area a move came from. An order block (ICT/SMC) is a refined subset — the last opposing candle before the move that broke structure. Many traders draw the zone first, then find the order block inside it to time an entry.
How do you identify and draw a demand zone?
Find a base — a brief pause — right before a strong rally (a Drop-Base-Rally or Rally-Base-Rally). Mark the proximal line at the top of the base and the distal line at the bottom. Traders tend to prefer a tight base, an explosive leg-out and a clear imbalance, ideally aligned with the higher-timeframe trend.
Do supply and demand zones actually work?
They are a probability tool, not a guarantee, and price often blows straight through. Zone identification is subjective and the institutional-order rationale is unproven. There is no robust evidence they are profitable alone — they need trend context, confirmation and disciplined risk management.
Which timeframe is best for supply and demand zones?
There is no single best timeframe. A common approach is to map major zones on a higher timeframe such as the daily or weekly, then refine entries on a lower timeframe like the 1H or 15m. Higher-timeframe zones are generally given more weight.
Why does price sometimes blow straight through a zone instead of reversing?
Usually because of strong opposing momentum, choppy or ranging conditions, a news catalyst, an already-tested (consumed) zone, or a low-quality zone with a weak base or leg-out. Zones work best alongside clear directional structure, not in isolation.
Risk disclosure
AlgoKings provides technical analysis indicators and educational material for informational purposes only. Nothing on this website is financial, investment or trading advice. Trading financial instruments carries a high level of risk and may not be suitable for every investor; you can lose some or all of your capital. Indicators do not predict future price movements and do not guarantee any outcome. You are solely responsible for your own trading decisions and risk management. Past performance is not indicative of future results.