Dealing Ranges and IPDA Explained
A dealing range is the price span between a significant swing high and swing low, split at its 50% midpoint into premium (the upper half), equilibrium (the middle), and discount (the lower half). IPDA, the "Interbank Price Delivery Algorithm," is ICT's name for the idea that price is delivered non-randomly toward liquidity and to rebalance inefficiencies. Both the ICT dealing range and IPDA are interpretive teaching frameworks from Michael J. Huddleston (the Inner Circle Trader), not officially documented market mechanics. They can be a useful lens for reading price, but neither is a proven edge on its own.
"Dealing range" and "IPDA" both come from ICT (Inner Circle Trader), the methodology taught by Michael J. Huddleston. This guide explains what they mean and how traders use them, and is upfront about what is solid, what is repackaged classical analysis, and what is marketing narrative. Nothing here is financial advice. These are analytical context tools, not signals or guarantees.
What is a dealing range in ICT?
A dealing range is the most recent meaningful leg of price action, bounded by a clear swing high and a clear swing low. Once you have those two boundaries, you split the range at its midpoint to create three zones. Think of it as the "arena" price is currently working inside, the reference frame against which cheap versus expensive is judged.
The three zones
- Equilibrium (EQ): the 50% midpoint, treated as "fair value." This is the same level as a Fibonacci 0.5 retracement, under a different name.
- Premium: the upper half, above EQ, considered "expensive," so the bias leans toward looking for sells.
- Discount: the lower half, below EQ, considered "cheap," so the bias leans toward looking for buys.
What makes a range "valid"
ICT teaching stresses that a dealing range should not be a tiny intraday wiggle. Practitioners look for a structurally significant swing high and low; displacement, meaning a strong move away from a boundary that often leaves Fair Value Gaps and implies real participation rather than chop; and frequently a liquidity sweep at the start, where price runs a prior high or low, takes the stops resting there, then reverses, with that reversal anchoring the range. A new dealing range forms only once price decisively trades outside the current one and continues.
Internal vs. external range liquidity
Closely tied to the dealing range is the idea of where liquidity rests, which ICT users treat as the "draw" that price moves toward.
- External Range Liquidity (ERL): stops resting above the swing high and below the swing low, that is, at the boundaries themselves.
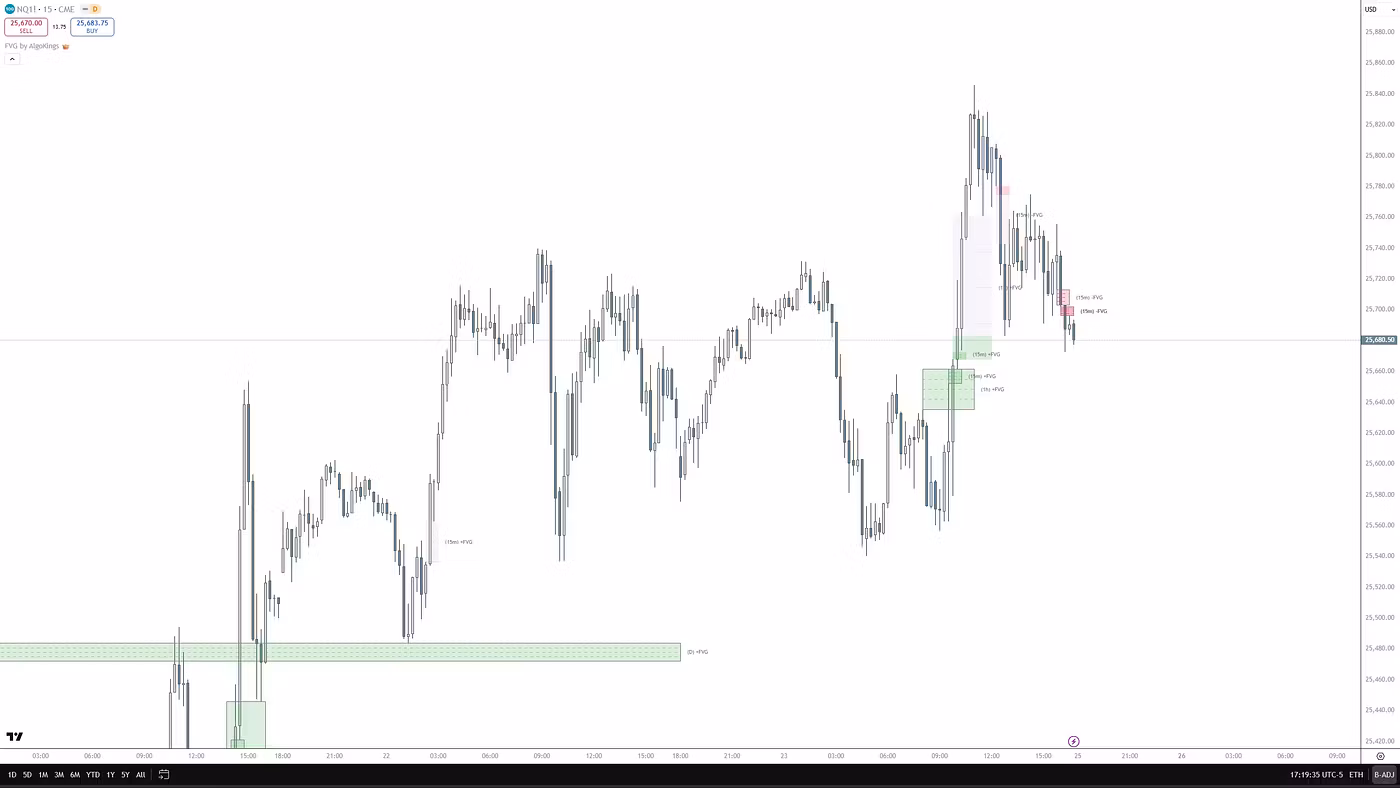
- Internal Range Liquidity (IRL): liquidity inside the range, chiefly Fair Value Gaps and order blocks that price tends to return to and fill.
The narrative is that price oscillates between IRL and ERL: it fills an internal gap, then runs an external high or low, then returns to another internal inefficiency, and so on. This is the reasoning behind directional bias and the question of where price is drawing to next.
What is IPDA, and is it a real algorithm?
IPDA stands for Interbank Price Delivery Algorithm. In ICT, it is the claimed "engine" of price: the idea that price is delivered non-randomly to take liquidity where stops cluster and to rebalance inefficiencies like gaps. Here is the honest part. No bank or exchange has published such an algorithm, and no one has produced a verifiable, named "IPDA." Treat it as a conceptual model for how price appears to behave, not a documented fact. The strong version of the claim, that a secret bank algorithm hunts retail stops, is widely criticized as unfalsifiable. Use IPDA as a way ICT describes price behavior, never as established mechanics.
IPDA data ranges: the 20 / 40 / 60-day lookback
Separate from the conceptual model is the concrete, teachable part that indicators actually draw. You look back over the last 20, 40, and 60 trading days, excluding weekends and holidays rather than counting calendar days. For each lookback you mark the high, the low, and the 50% equilibrium. Those levels become reference points and potential targets.
- 20-day range: short-term reference and nearer targets.
- 40-day range: intermediate reference.
- 60-day range: major, longer-term reference.
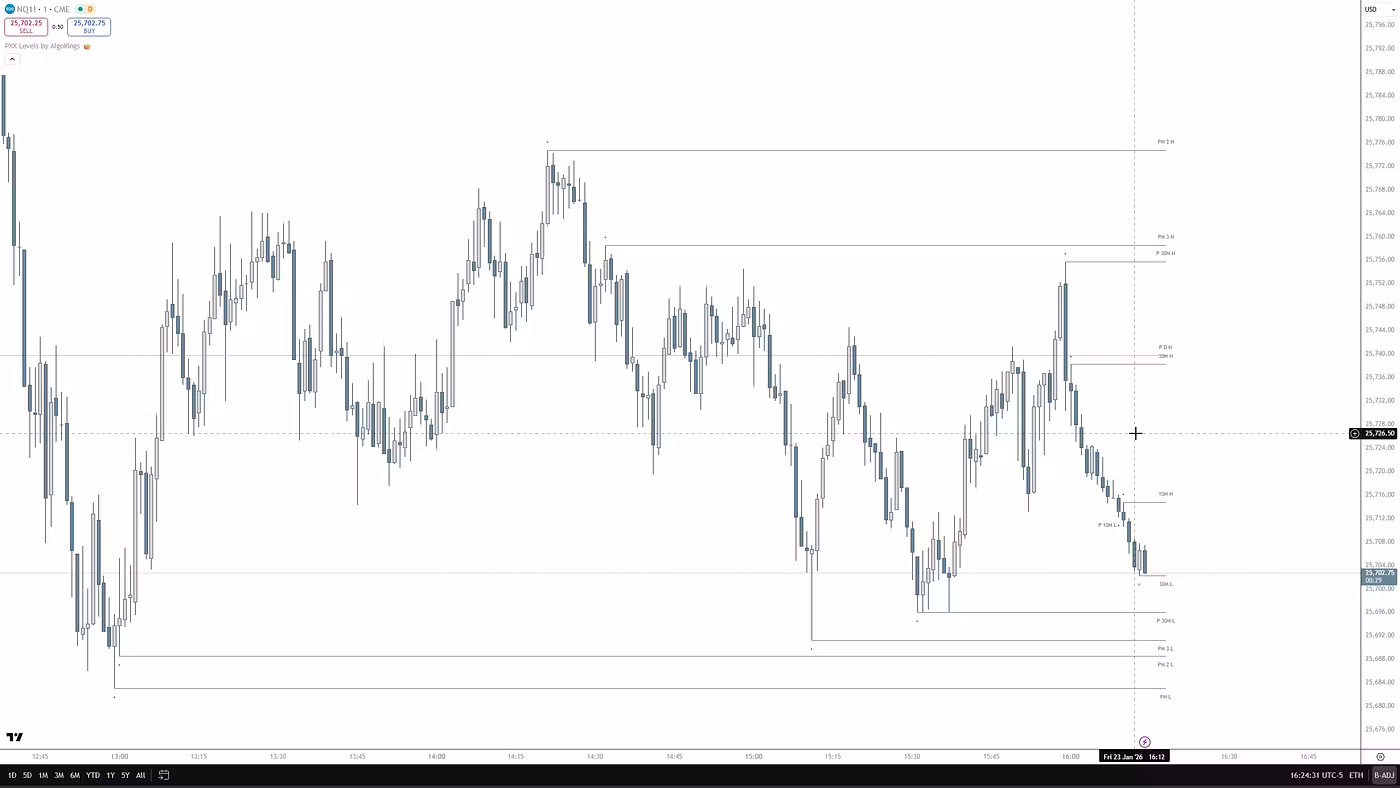
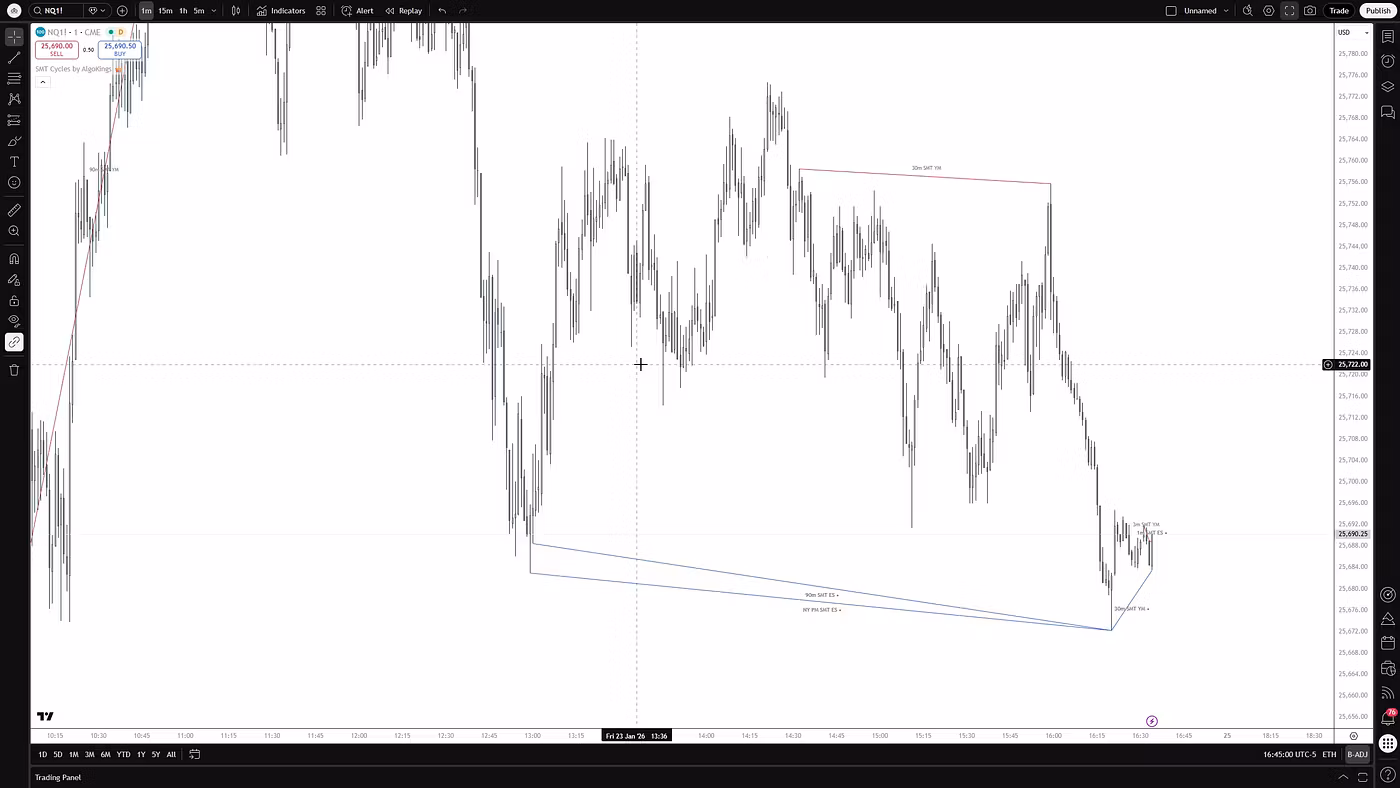
On rolling behavior, practitioners disagree. The common narrative is that roughly every 20 trading days a fresh liquidity pool forms on each side; some teachings instead re-anchor at the start of the month or week. Most automated tools simply roll the last 20, 40, and 60 trading days and update once per new day, which means they generally do not repaint intraday. AlgoKings' PXX Levels and SMT tooling can plot these kinds of mechanical reference levels for you, but the levels are reference areas, not guaranteed reaction points.
Dealing range vs. IPDA data ranges: don't confuse them
This is a frequent point of confusion, so keep the distinction sharp:
- A dealing range is discretionary and structure-based. You choose a swing high and swing low on whatever timeframe you trade, so two traders can draw different ones.
- IPDA data ranges are fixed and mechanical: a 20/40/60 trading-day lookback computed automatically, the same for everyone.
They share the same building blocks (high, low, 50% equilibrium, and premium/discount logic), but one is subjective and one is rule-based. They are related tools, not the same tool.
A typical workflow (one approach, not a recommendation)
Here is how many ICT users put the pieces together. It is a framework for organizing decisions, not a mechanical buy/sell system:
- Define the dealing range on a higher timeframe that suits your style (Daily, 4H, or 1H).
- Mark equilibrium, premium, and discount.
- Use higher-timeframe bias as a filter: in a bullish context, look for longs in discount; in a bearish context, look for shorts in premium.
- Drop to a lower timeframe only for execution, entering at a point of interest such as an FVG or order block within the favored zone.
- Place stops beyond the relevant swing, keeping in mind that those obvious highs and lows are exactly where liquidity sweeps tend to target, so stops sitting uncomfortably tight to them are vulnerable.
Is this just repackaged classical TA?
In part, yes, and that is fine if you know it. Equilibrium is the 50% retracement, and premium/discount is mean reversion relative to a range midpoint. The honest framing: it is a coherent way to organize structure, liquidity, and inefficiency into a single bias, but none of it is statistically validated in public literature, and outcomes depend heavily on the trader's subjective range selection, which makes it hard to backtest objectively. It can be a useful lens. It is not a proven, mechanical edge.
Frequently asked questions
What is a dealing range in ICT, and how do I draw it correctly?
It is the span between a significant swing high and swing low, the most recent meaningful leg of price. Draw it on a timeframe that suits your style, anchoring to obvious, structurally significant turning points, ideally where you also saw displacement or a liquidity sweep. Then split it at the 50% midpoint into premium, equilibrium, and discount. Avoid drawing it around a tiny intraday wiggle, and do not redraw it every new candle.
Is equilibrium just the 50% Fibonacci retracement?
Yes. Equilibrium is the 50% midpoint of the dealing range, which is the same level as a Fibonacci 0.5 retracement. Above it is premium ("expensive"); below it is discount ("cheap"). The terms are ICT's framing of a mean-reversion idea relative to a range midpoint.
Is the Interbank Price Delivery Algorithm (IPDA) a real algorithm?
No bank or exchange has published or confirmed such an algorithm, and no verifiable named "IPDA" exists. It is a conceptual model, a way ICT describes price seeking liquidity and rebalancing inefficiencies. Treat it as a mental framework, not documented market mechanics. The claim that a secret bank algorithm hunts retail stops is unfalsifiable and should be read as narrative, not fact.
Do I count IPDA's 20/40/60 ranges in trading days or calendar days, and do they reset?
Trading days, with weekends and holidays excluded. For each of the 20-, 40-, and 60-day lookbacks you mark the high, low, and 50% equilibrium. On resets, practitioners differ: some roll the windows forward each new trading day, others re-anchor at the start of the month or week. Most automated indicators simply roll the last 20/40/60 trading days and update once per day.
What's the difference between a dealing range and IPDA data ranges?
A dealing range is discretionary and structure-based: you pick the swing high and low, so it is subjective. IPDA data ranges are a fixed, mechanical 20/40/60 trading-day lookback that is the same for everyone. They use the same high, low, and equilibrium logic, but one is judgment-based and one is rule-based.
Do dealing range and premium/discount setups actually work?
They can be a useful framework for organizing bias, liquidity, and inefficiency into one view, but there is no proven, mechanical edge in them on their own. Equilibrium is just the 50% retracement, and results depend heavily on which range you subjectively chose, which makes objective backtesting hard. Use them as context and filters alongside bias and a point of interest, not as standalone signals, and never as a promise of profit.
Risk disclosure
AlgoKings provides technical analysis indicators and educational material for informational purposes only. Nothing on this website is financial, investment or trading advice. Trading financial instruments carries a high level of risk and may not be suitable for every investor; you can lose some or all of your capital. Indicators do not predict future price movements and do not guarantee any outcome. You are solely responsible for your own trading decisions and risk management. Past performance is not indicative of future results.