The Best ICT Indicators for TradingView
The best ICT indicators for TradingView automatically detect and draw the price-action concepts taught by the Inner Circle Trader — order blocks, fair value gaps, liquidity, market-structure shifts and session killzones — so you spend less time marking levels by hand and more time reading the chart. They are analytical aids that render structure consistently; they are not strategies or buy/sell signals.
ICT stands for Inner Circle Trader, the alias of Michael J. Huddleston, who frames the market as driven by institutional ('smart money') order flow rather than retail chart patterns. Instead of lagging oscillators like RSI, MACD or moving averages, ICT indicators highlight structural elements — and a good one renders them objectively so your charts stay consistent from session to session.
What a good ICT indicator should do
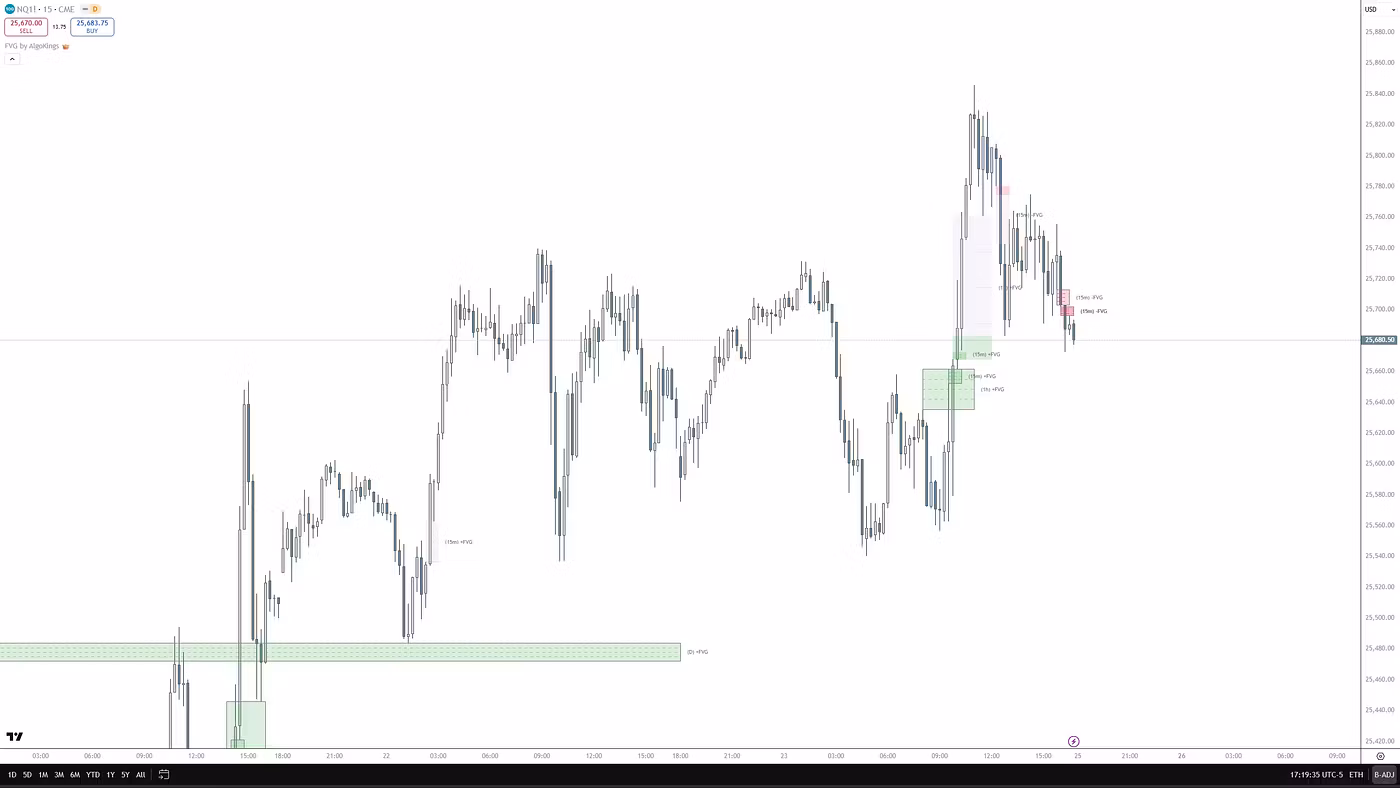
- Detects order blocks, fair value gaps (imbalances) and liquidity pools, and tracks them through to mitigation.
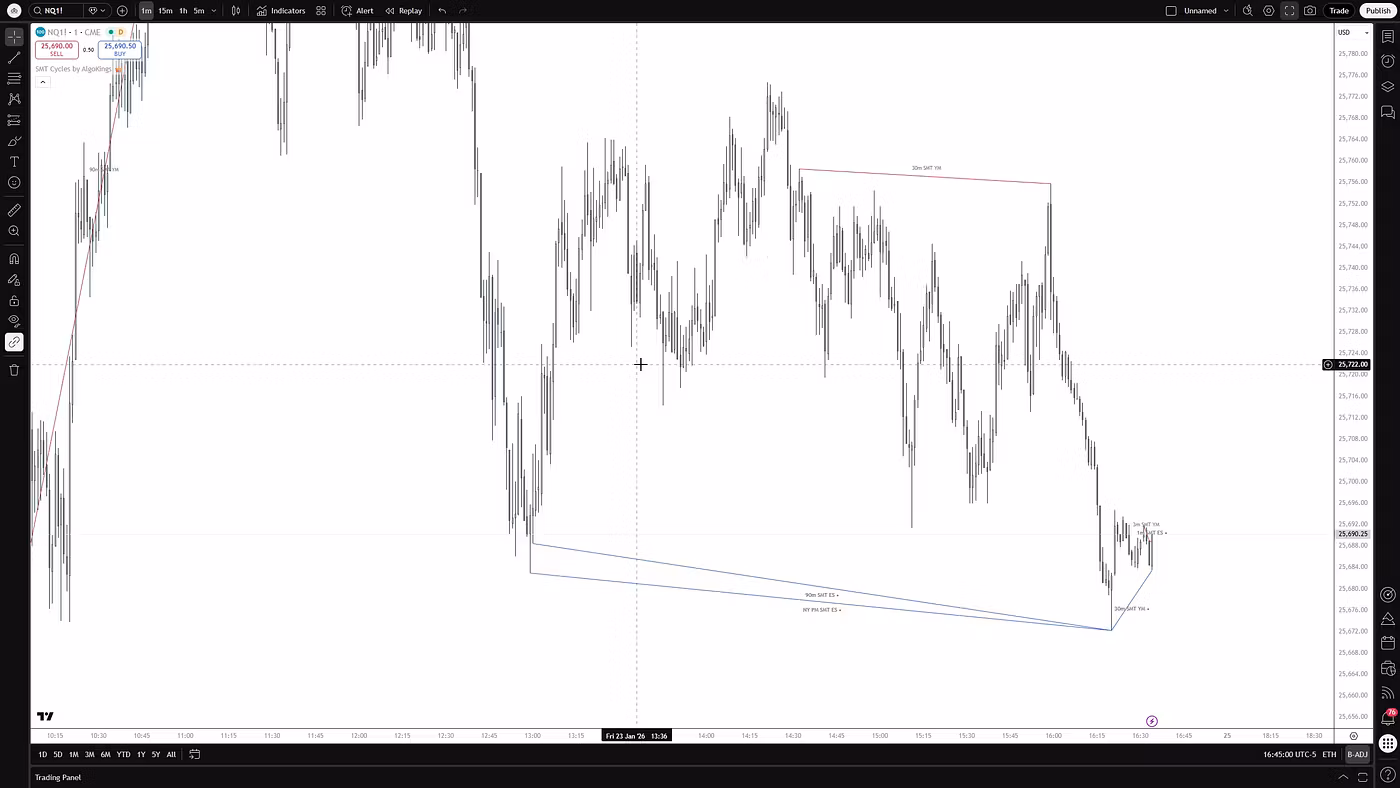
- Marks market-structure shifts — Break of Structure (BOS), Change of Character (CHoCH) and displacement.
- Maps session killzones (Asian, London, New York, London Close) so time-based context is visible at a glance.
- Is non-repainting — levels stay where they printed in real time rather than redrawing on hindsight.
- Stays clean and configurable, with alerts, so the chart informs rather than overwhelms.
The core ICT concepts, and what each one renders
Order blocks, FVGs and liquidity
These are the three most-plotted ICT elements. An order block is the last opposing candle before a strong, structure-breaking move. A fair value gap is a three-candle imbalance price often returns to rebalance. Liquidity sits above old highs and below old lows, where stops cluster. They are probabilistic areas of interest — not guaranteed reversal zones — and work best when they line up: for example, a liquidity sweep into an FVG that agrees with your higher-timeframe bias.
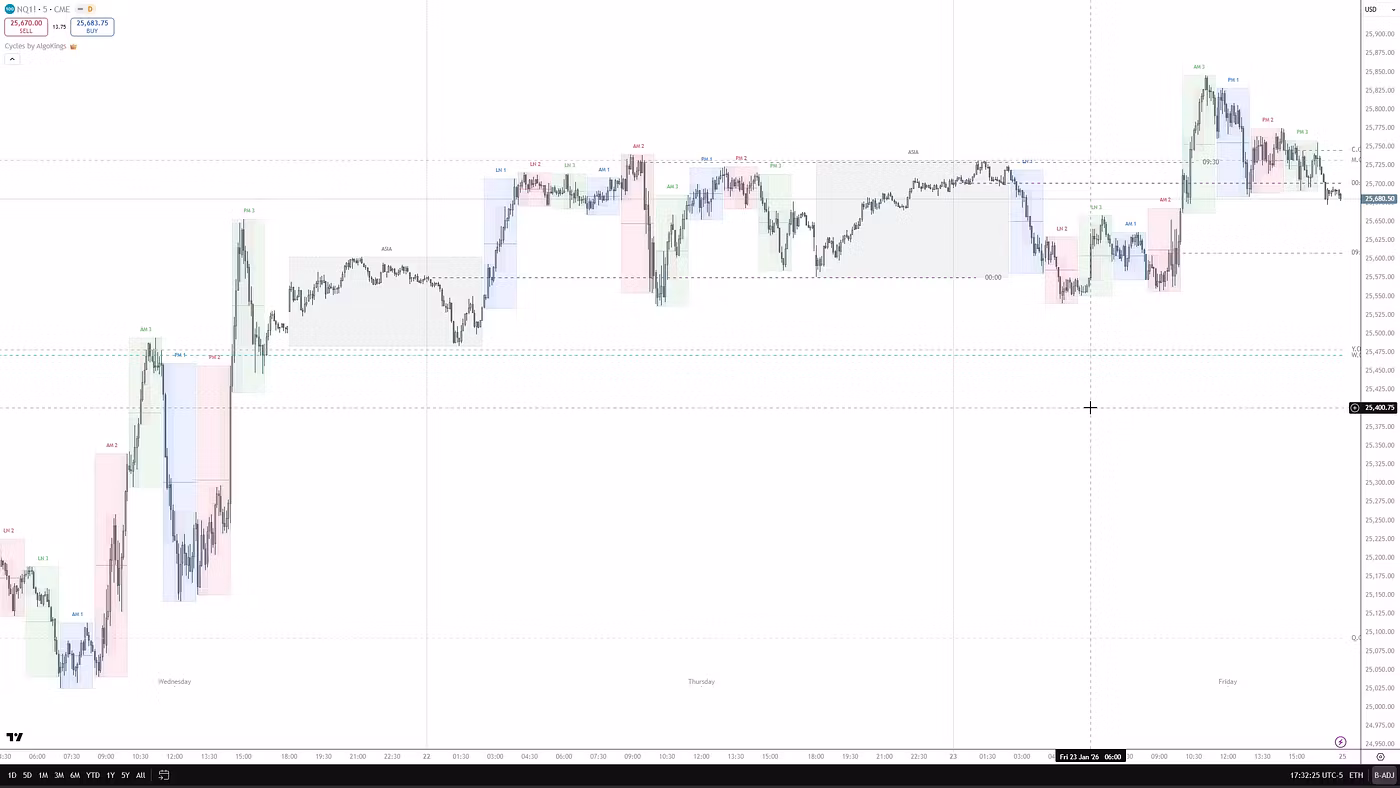
Market structure and killzones
BOS, CHoCH and displacement describe how structure is breaking, which keeps you aligned with the dominant trend. Killzones add the time dimension — the London and New York windows where ICT expects the most meaningful moves. Seeing both plotted automatically lets you frame setups by structure and timing instead of marking everything manually.
Free vs paid: what to know
TradingView's free plan limits you to two indicators and one alert per chart, which makes a clean, consolidated toolset more valuable than stacking many overlapping scripts. Hundreds of free ICT scripts exist and their quality varies enormously — LuxAlgo's 'ICT Concepts' is one of the most popular free all-in-ones, with paid suites like Trading IQ's 'ICT Master Suite' offering backtesting of specific models. High like-counts reflect visuals and marketing, not live results, so judge a tool on whether it is non-repainting, readable and well-supported — not on popularity.
How to use them well
- Work top-down: set bias on the Daily/4H, then refine entries on the 15m/1H — never trade a 5m gap in isolation.
- Pair one clean all-in-one tool with naked price action instead of overloading the chart with conflicting boxes.
- Require confluence — structure, liquidity, an FVG and timing agreeing — rather than acting on a single zone.
- Verify a tool is non-repainting and backtest it bar-by-bar; treat ICT concepts as a model, not verified institutional fact.
- Define risk per trade before entering, and review a meaningful sample (100+ trades) before drawing conclusions.
Frequently asked questions
What are ICT indicators and what does ICT stand for?
ICT stands for Inner Circle Trader, the alias of Michael J. Huddleston. ICT indicators are TradingView tools that automatically detect and draw his price-action concepts — order blocks, fair value gaps, liquidity, market-structure shifts and session killzones — instead of plotting classic oscillators like RSI or MACD.
Do ICT indicators repaint, and how do I avoid ones that do?
Some do. A repainting script recalculates on the unconfirmed live candle, so levels or signals that look perfect in hindsight may not have existed in real time. Check the developer's description for a non-repainting confirmation and verify by replaying the chart bar-by-bar before relying on a tool.
Can ICT indicators alone make me profitable?
No. They are analytical aids that mark levels and context — not strategies, signals or financial advice. ICT himself teaches reading 'naked' charts, and an indicator has no edge without an understanding of structure, liquidity and time, plus your own backtesting and risk management.
Risk disclosure
AlgoKings provides technical analysis indicators and educational material for informational purposes only. Nothing on this website is financial, investment or trading advice. Trading financial instruments carries a high level of risk and may not be suitable for every investor; you can lose some or all of your capital. Indicators do not predict future price movements and do not guarantee any outcome. You are solely responsible for your own trading decisions and risk management. Past performance is not indicative of future results.